What Is Correlation
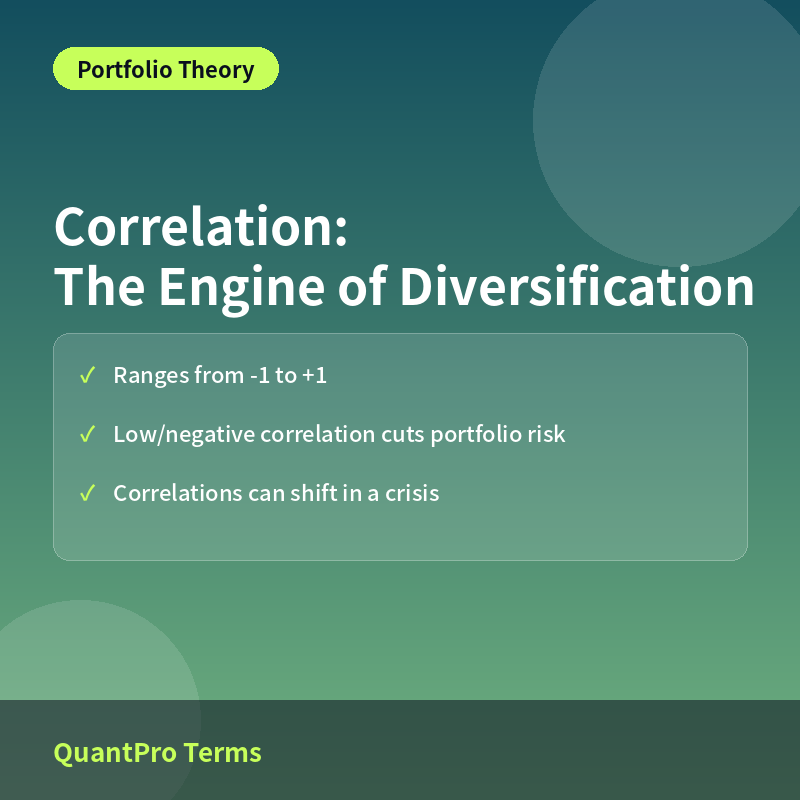
Correlation measures how closely the returns of two assets move in relation to each other, expressed as a value between -1 and +1. A correlation of +1 means two assets move in perfect lockstep, -1 means they move in exactly opposite directions, and 0 means their movements are statistically unrelated.
Understanding correlation is essential to portfolio construction because it directly determines how much genuine risk reduction diversification actually provides — simply holding more assets doesn’t reduce risk much if those assets are all highly correlated with each other.
Why Low Correlation Reduces Portfolio Risk
When two assets have low or negative correlation, their price movements tend to partially offset one another, which smooths out the combined portfolio’s overall volatility even if each individual asset is quite volatile on its own. This is the mathematical foundation behind the age-old advice not to ‘put all your eggs in one basket.’
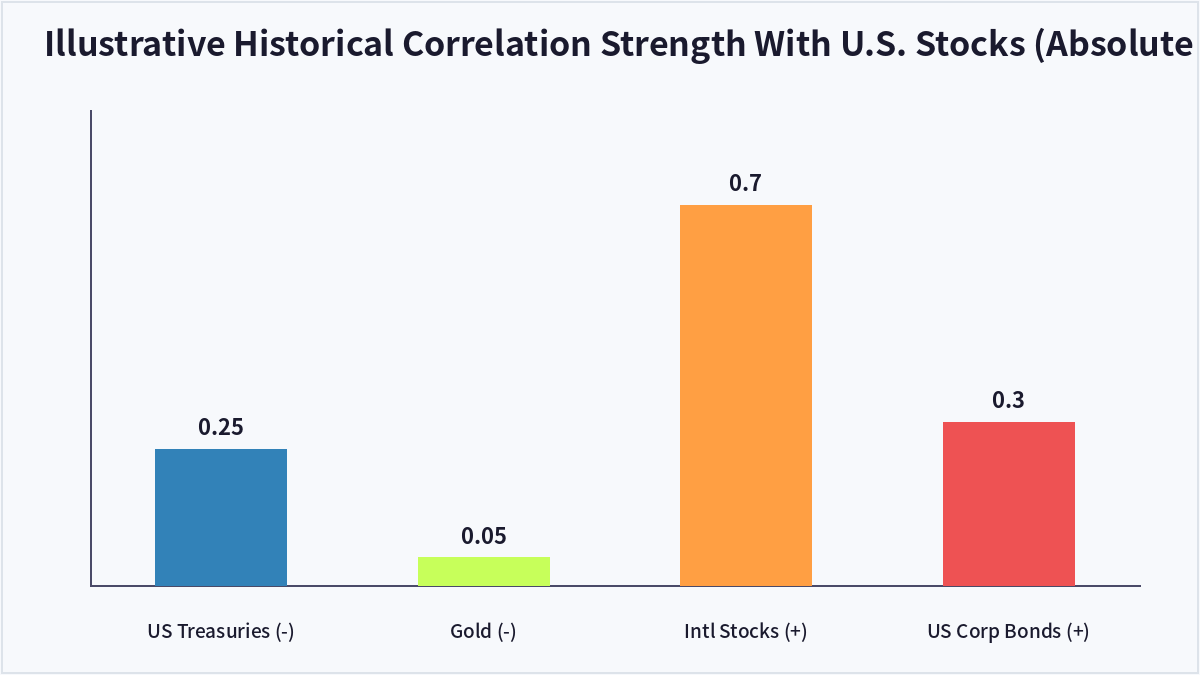
Looking at typical historical correlations, U.S. stocks and U.S. Treasury bonds have often shown a correlation around -0.2 to -0.3 (a mild inverse relationship), stocks and gold around 0.0 to -0.1 (largely unrelated), and stocks across different countries often show a correlation closer to +0.6 to +0.8, reflecting how global equity markets tend to move together during broad risk-on/risk-off swings.
Limitations of Correlation-Based Diversification
One important caveat is that correlations are not fixed — they can shift meaningfully over time, and historically, correlations between risk assets have tended to rise sharply during market crises, precisely when diversification benefits are needed most. Assets that appeared only loosely correlated in calm markets can move together far more closely during a broad sell-off.
Because of this, relying purely on historical correlation figures without stress-testing how a portfolio might behave during a crisis can lead to an overly optimistic view of its actual diversification benefits.
| Correlation Range | Relationship | Diversification Value |
|---|---|---|
| +0.7 to +1.0 | Move closely together | Low |
| 0 to +0.3 | Largely unrelated | Moderate to high |
| -1.0 to -0.1 | Tend to move oppositely | High |
Frequently Asked Questions
Does a negative correlation guarantee a profit when one asset falls?
No — negative correlation only describes a statistical tendency for two assets to move in opposite directions on average, not a guaranteed inverse relationship on any single day.
Why do correlations tend to rise during a crisis?
Broad market panic often triggers widespread selling across many asset classes simultaneously as investors seek liquidity, which can temporarily push correlations between normally unrelated assets much higher than their historical average.
How can I find the correlation between two assets?
Correlation can be calculated directly from historical return data using standard statistical tools, and many financial data platforms and portfolio analysis services provide correlation matrices for common asset classes.
Is it enough to just add more assets to diversify a portfolio?
Not necessarily — adding assets that are all highly correlated with each other provides limited additional risk reduction. True diversification depends more on the correlation structure between holdings than simply the number of holdings.
Key Takeaways
Correlation measures how closely two assets’ returns move together, and combining assets with low or negative correlation is the core mechanism behind effective diversification. Because correlations can rise sharply during market stress, it’s important to view historical correlation figures as a guide rather than a guarantee. This article is for informational purposes only and does not constitute investment advice.

QuantPro: AI Finds the Trade Before You Do
From AI-powered chart analysis to real-time market intelligence — everything a serious investor needs, in one platform.
- Automated AI chart analysis with precision trend timing
- Bull Radar: real-time visualization of geopolitical & economic shifts
- Live market-moving news and insights, curated for you

Bull Wave / Bear Wave Forecast Model
Engineered to help you read market direction and momentum faster than the crowd.
- Instantly separate bullish momentum from bearish pressure
- Pinpoint high-probability entry zones with confidence
- Chart signals clear enough for beginners, sharp enough for pros

Winning Pattern Detection
Instantly surfaces the high-probability setups that repeat across the charts — a trusted edge for timing your entries and exits.
- Spot momentum building in real time
- Catch trend-reversal points before they break
- Built for active traders who need results, not theory

AI Live Economic Dashboard
AI analyzes real-time market data — turning complex, global investment flows into clear insight in seconds.
- Track global stock markets in real time
- See exactly which assets are strong — and which are fading
- Watch how geopolitical events move the markets
About the Author