What Is the Laffer Curve?
The Laffer Curve is an economic concept that illustrates the relationship between a tax rate and the total tax revenue a government collects. Popularized by economist Arthur Laffer in the 1970s, the idea is simple to state: a 0% tax rate raises no revenue because there is no tax at all, and a 100% tax rate also raises no revenue, because no one has an incentive to earn taxable income if the government keeps every dollar of it. Somewhere between those two extremes, revenue rises, peaks, and then falls, forming an inverted U-shaped curve when plotted against the tax rate.
How the Laffer Curve Works
The Arithmetic Effect vs. the Economic Effect
The curve’s shape comes from two forces pulling in opposite directions. The arithmetic effect says that, holding economic activity constant, a higher tax rate mechanically raises more revenue per dollar earned. The economic effect says that a higher tax rate discourages the activity being taxed: people work less, invest less, shift income into tax-sheltered forms, or move activity underground or offshore. At low tax rates, the arithmetic effect dominates, so raising rates raises revenue. At very high tax rates, the economic effect dominates, so raising rates further shrinks the taxable base faster than the rate increases, and revenue falls.
The Revenue-Maximizing Tax Rate
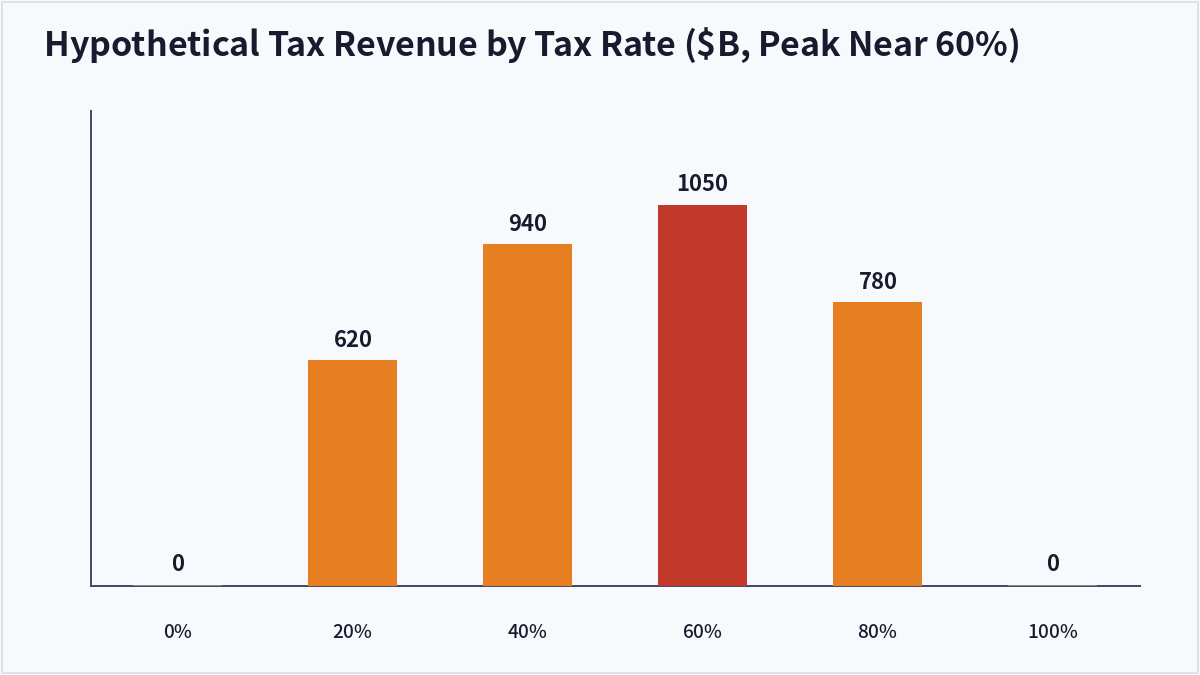
To see the idea in numbers, consider a hypothetical economy where government revenue is $0 billion at a 0% tax rate, rises to $620 billion at a 20% rate, $940 billion at a 40% rate, peaks around $1,050 billion near a 60% rate, then falls back to $780 billion at an 80% rate and to $0 again at a 100% rate. The tax rate at the very top of the curve is often called the revenue-maximizing rate, sometimes labeled t*. On this hypothetical curve, t* sits near 60%.
Where a Country Sits on the Curve Matters
The Laffer Curve’s practical implication depends entirely on which side of the peak an economy’s current tax rate sits on. If the current rate is below the revenue-maximizing rate, cutting taxes further reduces revenue, because the arithmetic effect still dominates. If the current rate is above the revenue-maximizing rate, cutting taxes toward that peak can actually raise revenue, because the economic effect (a larger taxable base) outweighs the smaller rate applied to it. This is why the same curve can be used to argue for opposite policies depending on where a policymaker believes the current rate falls.
Real-World Evidence and Limitations
Empirical Estimates of the Peak
Economists have tried to estimate where the revenue-maximizing point actually sits for real economies. Published estimates for top labor-income tax rates in developed countries commonly cluster in a wide range, often cited around 60-70%, though estimates vary substantially by country, time period, and what behavioral responses are assumed. Because the true peak cannot be observed directly, only inferred from historical data and models, there is no single, universally agreed number, and most economists caution against pinpointing an exact figure.
Common Criticisms
The Laffer Curve is frequently criticized for being used as a blanket justification that any tax cut pays for itself, which the theory does not actually claim. Other limitations include: the peak is unobservable in real time and can shift as the economy changes; different types of taxes (labor income, capital gains, corporate) likely have different curves and different peaks; behavioral responses to tax changes can take years to fully materialize, complicating short-term revenue estimates; and the curve says nothing about the distributional effects of a tax change, only about total revenue.
| Position vs. t* | Effect of a Rate Cut on Revenue | Dominant Force |
|---|---|---|
| Rate is below t* | Revenue falls | Arithmetic effect dominates |
| Rate is near t* | Revenue roughly unchanged | Effects largely offset |
| Rate is above t* | Revenue rises | Economic effect dominates |
Frequently Asked Questions
Who created the Laffer Curve?
The concept is named after economist Arthur Laffer, who popularized it in the mid-1970s, though the underlying intuition — that tax rates of 0% and 100% both raise no revenue — had been noted by earlier economists and thinkers well before Laffer’s name became attached to it.
Does the Laffer Curve mean all tax cuts pay for themselves?
No. The Laffer Curve only implies that a tax cut can increase revenue if the current rate is above the revenue-maximizing point. If the current rate is below that point, which most empirical estimates suggest is the more common real-world situation, a tax cut reduces revenue rather than paying for itself.
What is the revenue-maximizing tax rate?
There is no single, agreed-upon number. It depends on the tax being studied, the country, the time period, and the behavioral assumptions used in the analysis. It is a theoretical point on the curve, not a fixed constant, and economists’ empirical estimates vary widely.
Is the Laffer Curve actually used in real policymaking?
Elements of the underlying logic appear in official government revenue forecasting, particularly in “dynamic scoring,” where agencies attempt to estimate how a tax change might affect economic behavior and, in turn, revenue, rather than assuming the tax base stays fixed. The exact shape or peak of any real-world Laffer Curve remains a matter of ongoing debate among economists.
Key Takeaways
The Laffer Curve illustrates that tax revenue is not a simple straight-line function of the tax rate: it rises, peaks, and eventually falls as rates approach 100%. Its real-world usefulness hinges on correctly identifying where an economy currently sits relative to that peak, which is inherently uncertain and estimated only indirectly. It is a framework for thinking about tradeoffs, not a precise formula, and it does not by itself settle whether any specific tax cut or increase is good policy. This article is for informational purposes only and does not constitute investment advice.

QuantPro: AI Finds the Trade Before You Do
From AI-powered chart analysis to real-time market intelligence — everything a serious investor needs, in one platform.
- Automated AI chart analysis with precision trend timing
- Bull Radar: real-time visualization of geopolitical & economic shifts
- Live market-moving news and insights, curated for you
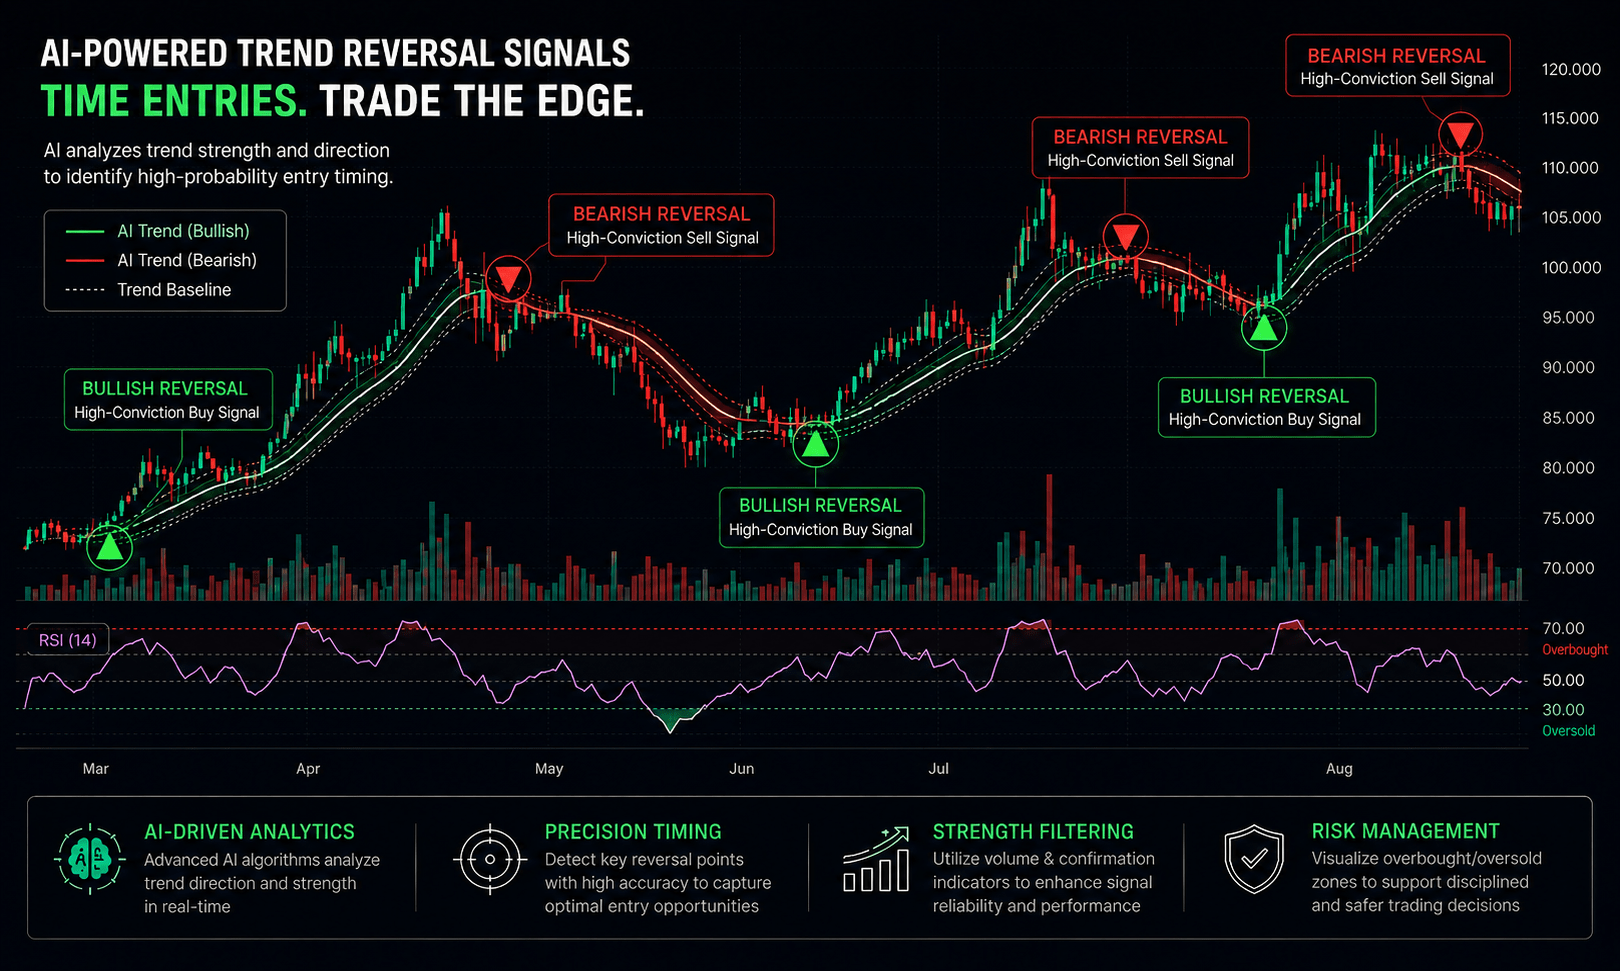
Bull Wave / Bear Wave Forecast Model
Engineered to help you read market direction and momentum faster than the crowd.
- Instantly separate bullish momentum from bearish pressure
- Pinpoint high-probability entry zones with confidence
- Chart signals clear enough for beginners, sharp enough for pros
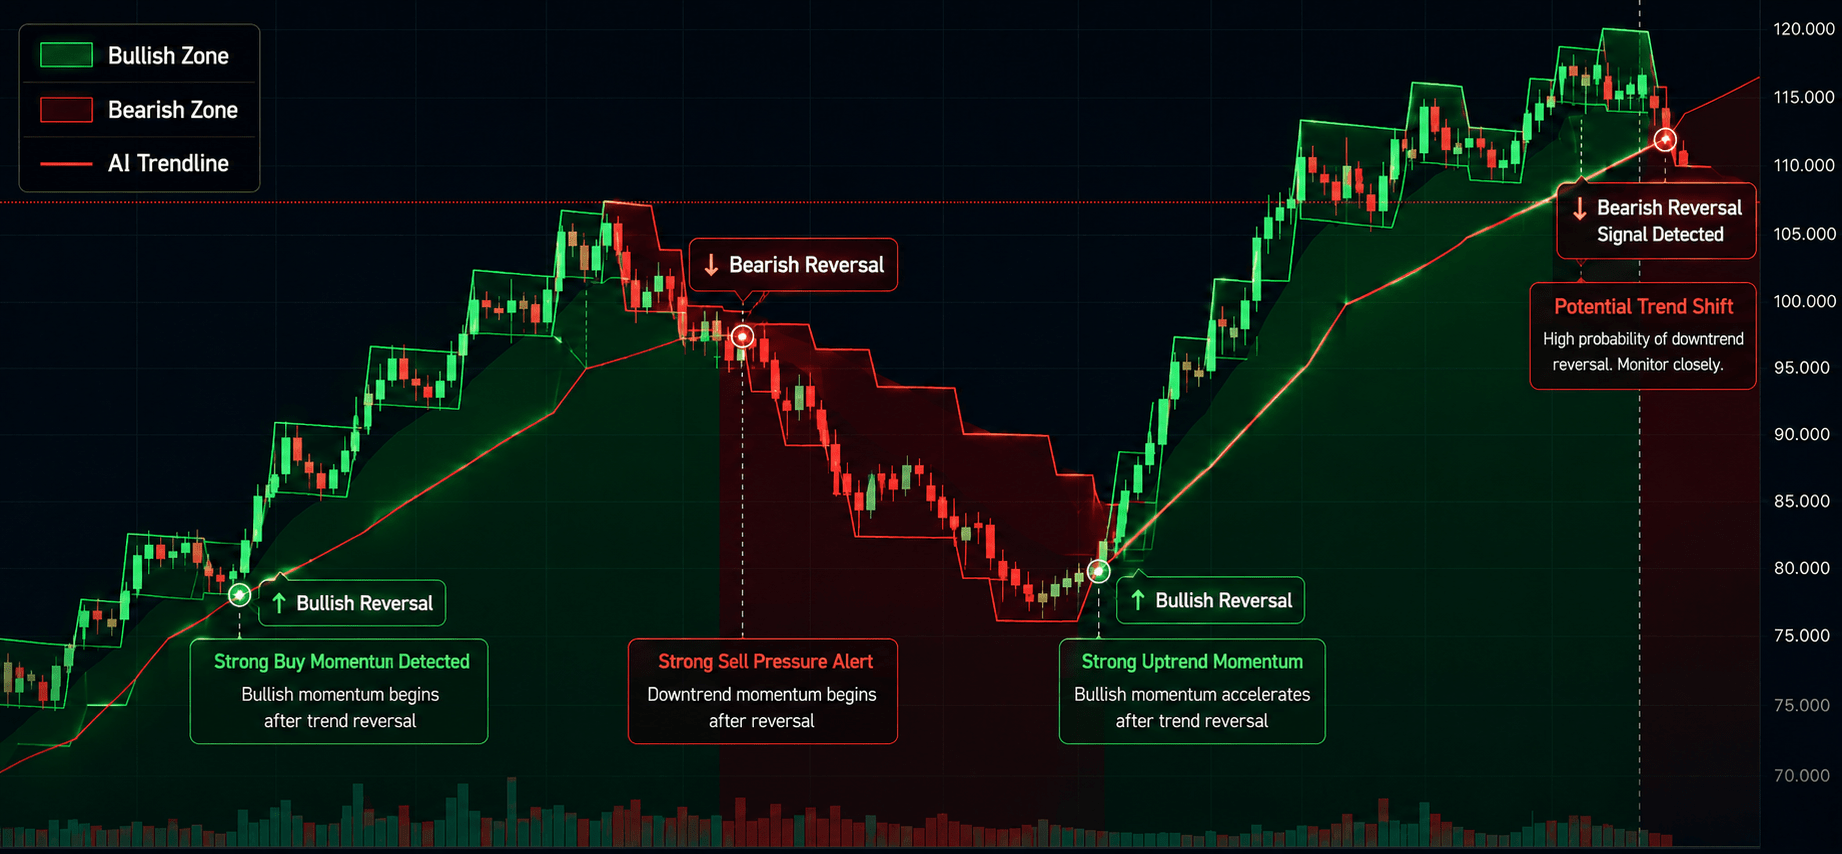
Winning Pattern Detection
Instantly surfaces the high-probability setups that repeat across the charts — a trusted edge for timing your entries and exits.
- Spot momentum building in real time
- Catch trend-reversal points before they break
- Built for active traders who need results, not theory

AI Live Economic Dashboard
AI analyzes real-time market data — turning complex, global investment flows into clear insight in seconds.
- Track global stock markets in real time
- See exactly which assets are strong — and which are fading
- Watch how geopolitical events move the markets
About the Author