What Is a Liquidity Trap?
A liquidity trap is an economic situation in which interest rates are pushed down to, or very close to, zero, yet monetary policy loses its usual ability to stimulate borrowing, spending, and investment. The concept originates with John Maynard Keynes, who observed that once interest rates fall low enough, households and businesses may prefer to simply hold cash rather than invest it or lend it out, because expected returns on other assets no longer look attractive relative to the near-zero opportunity cost of holding cash.
In a liquidity trap, additional monetary stimulus, such as further interest rate cuts or expanding the money supply, largely gets absorbed into idle cash balances (hoarding) instead of flowing into new spending or investment, which is why the trap is described as a point where conventional monetary policy loses traction.
How a Liquidity Trap Develops
A liquidity trap typically emerges after a severe demand shock or financial crisis, when central banks cut interest rates aggressively to fight a recession. As rates approach zero, what economists call the “effective lower bound,” there is little room left for further conventional cuts. At the same time, widespread pessimism about future growth can make households and firms reluctant to borrow and spend even at extremely cheap financing costs, and banks may become reluctant to lend if they doubt borrowers’ ability to repay, breaking the usual chain from lower rates to higher spending.
Historical Case: The US Federal Funds Rate, 2007-2015
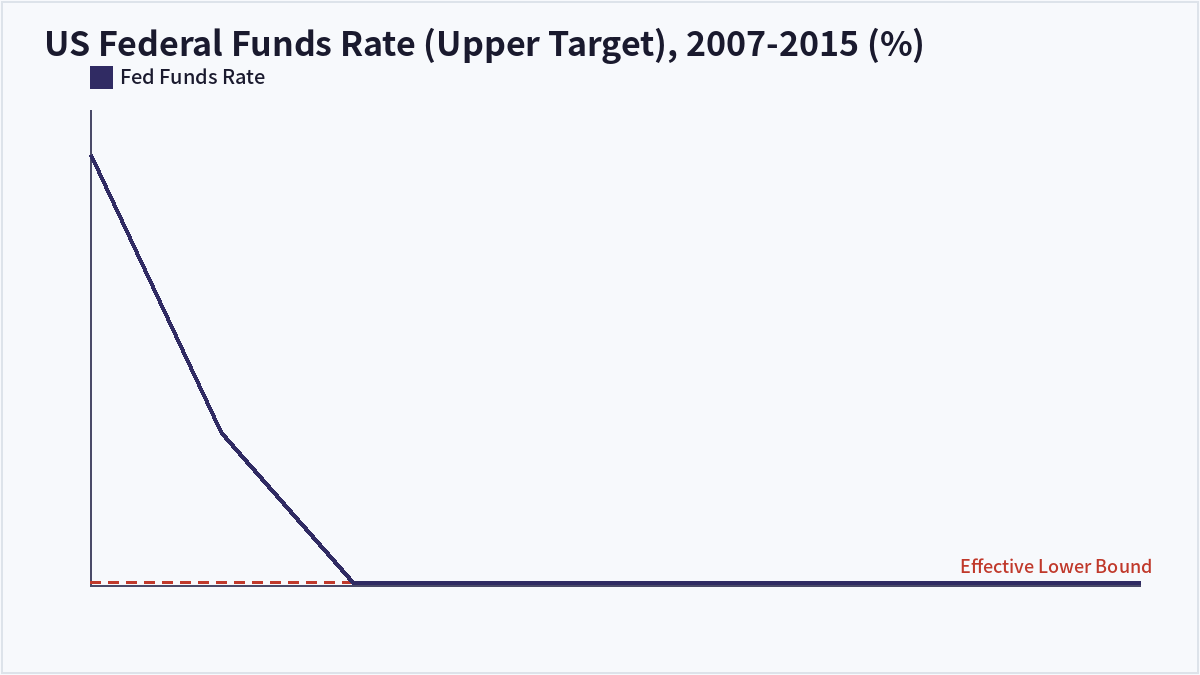
The 2008 global financial crisis produced one of the clearest modern liquidity trap episodes. The US Federal Reserve cut its federal funds rate target from 5.25% in mid-2007 to a range of 0% to 0.25% by December 2008, and held it near that floor for roughly seven years, through late 2015. With conventional rate cuts exhausted, the Fed turned to unconventional tools, most notably large-scale asset purchases known as quantitative easing (QE) and explicit forward guidance about the future path of rates, precisely because the normal transmission channel of rate cuts had reached its limit.
Historical Case: Japan’s Lost Decades
Japan is often cited as the textbook liquidity trap example. Following the collapse of its asset price bubble in the early 1990s, the Bank of Japan cut rates toward zero by the late 1990s and has kept policy rates near zero, and at times negative, for most of the period since, while the economy struggled for years with weak growth and, at times, outright deflation. Japan’s experience motivated much of the modern academic literature on liquidity traps and unconventional monetary policy tools, since it demonstrated the phenomenon could persist for many years rather than resolving quickly.
How Policymakers Respond to a Liquidity Trap
Because conventional interest rate cuts lose effectiveness in a liquidity trap, policymakers generally turn to a different toolkit: fiscal stimulus (direct government spending or tax cuts to boost demand directly, bypassing the interest rate channel), quantitative easing (large-scale asset purchases intended to lower longer-term borrowing costs and inject liquidity directly into the financial system), and forward guidance (committing to keep rates low for an extended period to shape expectations and encourage current spending).
| Aspect | Normal Conditions | Liquidity Trap |
|---|---|---|
| Effect of rate cuts | Lowers borrowing costs, boosts spending and investment | Little additional effect; rates already near zero |
| Money demand | Finite; falls as rates fall | Near-unlimited; extra cash is largely hoarded |
| Preferred policy tool | Conventional interest rate cuts | Fiscal stimulus, quantitative easing, forward guidance |
| Historical example | Most recessions before the effective lower bound is reached | Japan (1990s-2000s), US/Eurozone (2008-2015), global (2020-2021) |
Frequently Asked Questions
What is the difference between a liquidity trap and simply low interest rates?
Low interest rates alone are not a liquidity trap; a liquidity trap specifically refers to the condition where further rate cuts, or additional money supply, fail to meaningfully stimulate borrowing and spending because cash is instead hoarded. Rates can be low without a full liquidity trap if monetary policy is still effectively transmitting into the real economy.
Why doesn’t quantitative easing always work well in a liquidity trap?
Quantitative easing adds liquidity to the financial system and can lower longer-term borrowing costs, but if banks remain cautious about lending and households and firms remain reluctant to borrow and spend regardless of cost, much of that added liquidity can simply sit as reserves or cash rather than translating into new economic activity, which is why fiscal stimulus is often viewed as a necessary complement.
Can a liquidity trap cause deflation?
A liquidity trap can coincide with, or contribute to, deflationary or disinflationary pressure, since weak spending and investment reduce demand-driven price pressure. Japan’s experience with prolonged low inflation and periods of outright deflation alongside near-zero rates is frequently cited as an example of this relationship, though the causes of any specific deflationary episode are typically debated among economists rather than attributed to a single factor.
How does a liquidity trap end?
A liquidity trap typically eases once demand recovers enough that households and businesses regain confidence to borrow and spend even at low rates, often assisted by sustained fiscal stimulus, improved credit conditions, or a broader economic recovery that restores normal transmission of monetary policy. There is no fixed timeline; historical episodes have lasted anywhere from a few years to well over a decade.
Key Takeaways
A liquidity trap occurs when interest rates fall to, or near, zero and further conventional monetary easing stops translating into more borrowing, spending, or investment, because cash is hoarded instead. The US federal funds rate’s seven-year stay near zero after 2008 and Japan’s multi-decade experience with near-zero rates are the two most commonly cited real-world examples, and both prompted a shift toward unconventional tools like quantitative easing, forward guidance, and fiscal stimulus. This article is for informational purposes only and does not constitute investment advice.

QuantPro: AI Finds the Trade Before You Do
From AI-powered chart analysis to real-time market intelligence — everything a serious investor needs, in one platform.
- Automated AI chart analysis with precision trend timing
- Bull Radar: real-time visualization of geopolitical & economic shifts
- Live market-moving news and insights, curated for you
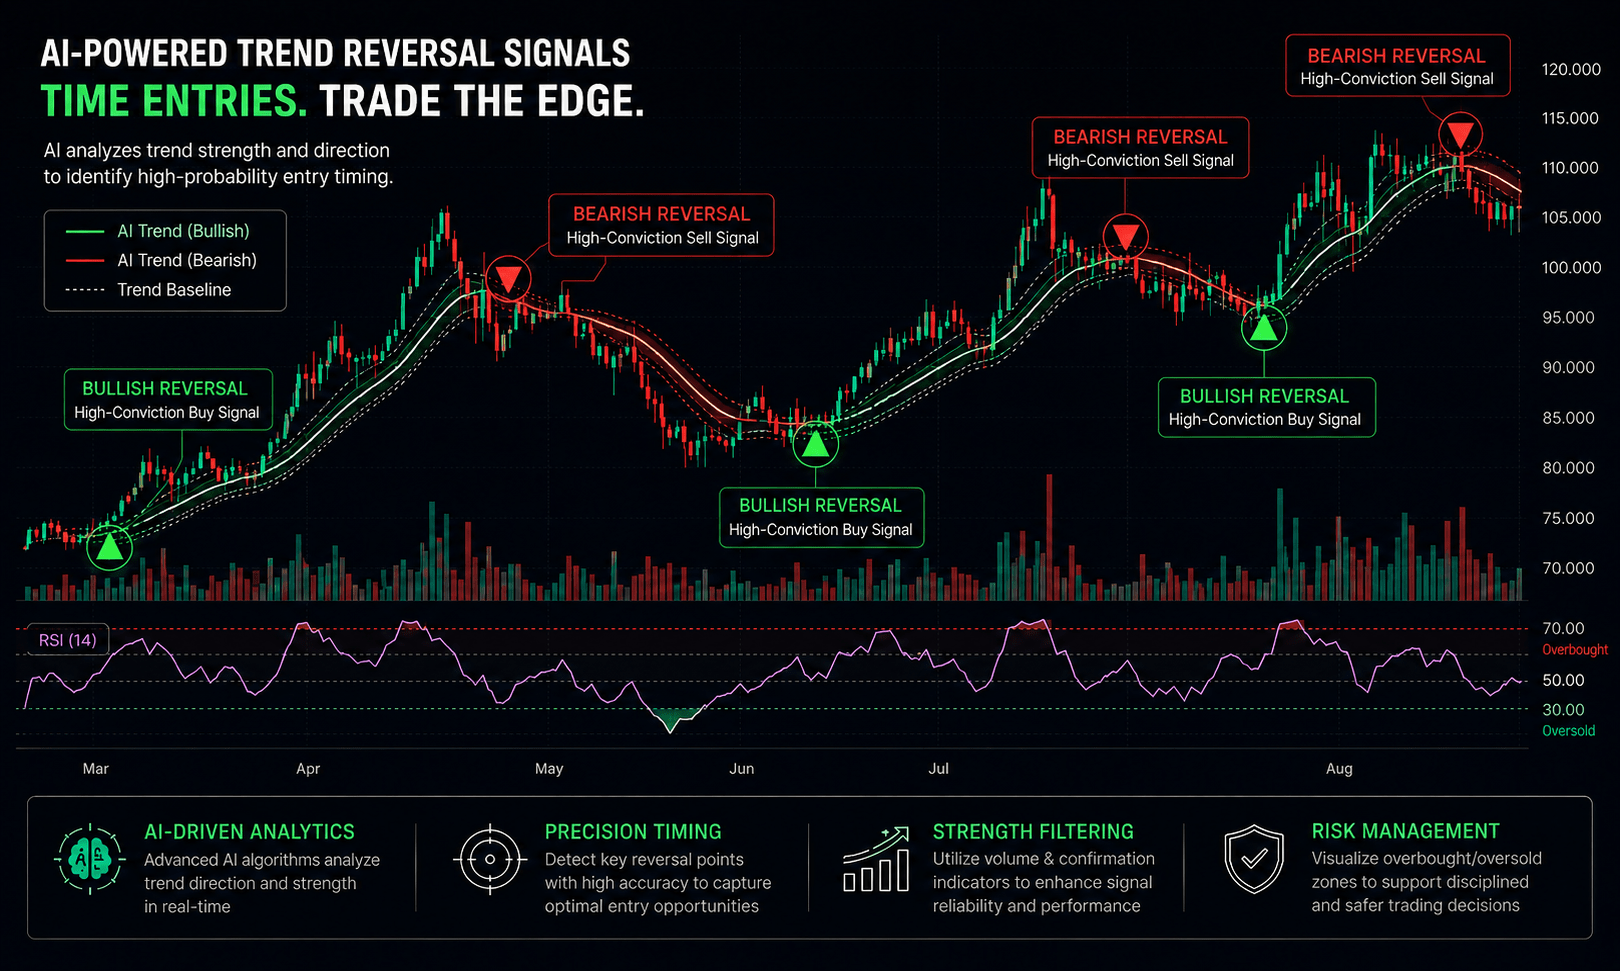
Bull Wave / Bear Wave Forecast Model
Engineered to help you read market direction and momentum faster than the crowd.
- Instantly separate bullish momentum from bearish pressure
- Pinpoint high-probability entry zones with confidence
- Chart signals clear enough for beginners, sharp enough for pros
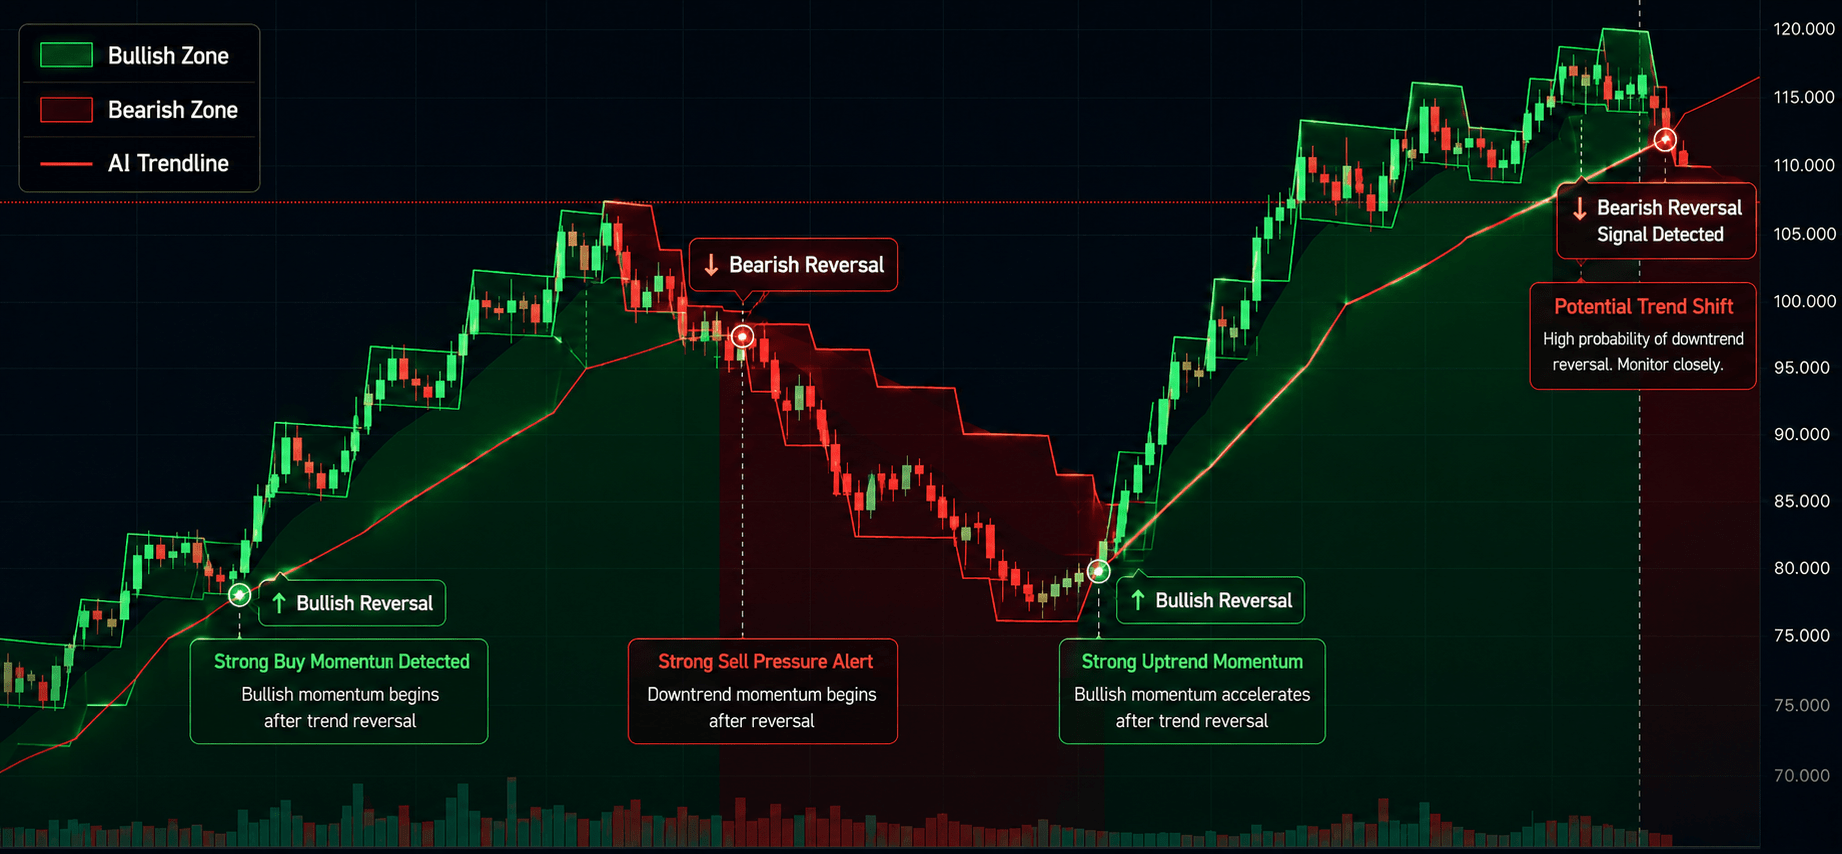
Winning Pattern Detection
Instantly surfaces the high-probability setups that repeat across the charts — a trusted edge for timing your entries and exits.
- Spot momentum building in real time
- Catch trend-reversal points before they break
- Built for active traders who need results, not theory

AI Live Economic Dashboard
AI analyzes real-time market data — turning complex, global investment flows into clear insight in seconds.
- Track global stock markets in real time
- See exactly which assets are strong — and which are fading
- Watch how geopolitical events move the markets
About the Author