What Is the Payback Period?
The payback period is the amount of time it takes for the cash flows generated by an investment to recover the initial cost of that investment. It is one of the oldest and simplest capital budgeting tools: rather than measuring how much value a project creates, it measures how quickly the company gets its money back, which makes it a useful first-pass filter for liquidity risk and capital recovery speed.
Because it is expressed in a straightforward unit, years (or months), the payback period is easy to explain to non-financial stakeholders and is commonly used as a quick screening tool before a more rigorous NPV or IRR analysis is performed.
How to Calculate the Payback Period
When annual cash flows are equal, the calculation is simple division: Payback Period = Initial Investment / Annual Cash Flow. When cash flows are uneven, which is far more common in practice, the calculation instead tracks cumulative cash flow year by year until it equals or exceeds the initial investment, then interpolates within the year the crossover happens.
Worked Example with Uneven Cash Flows
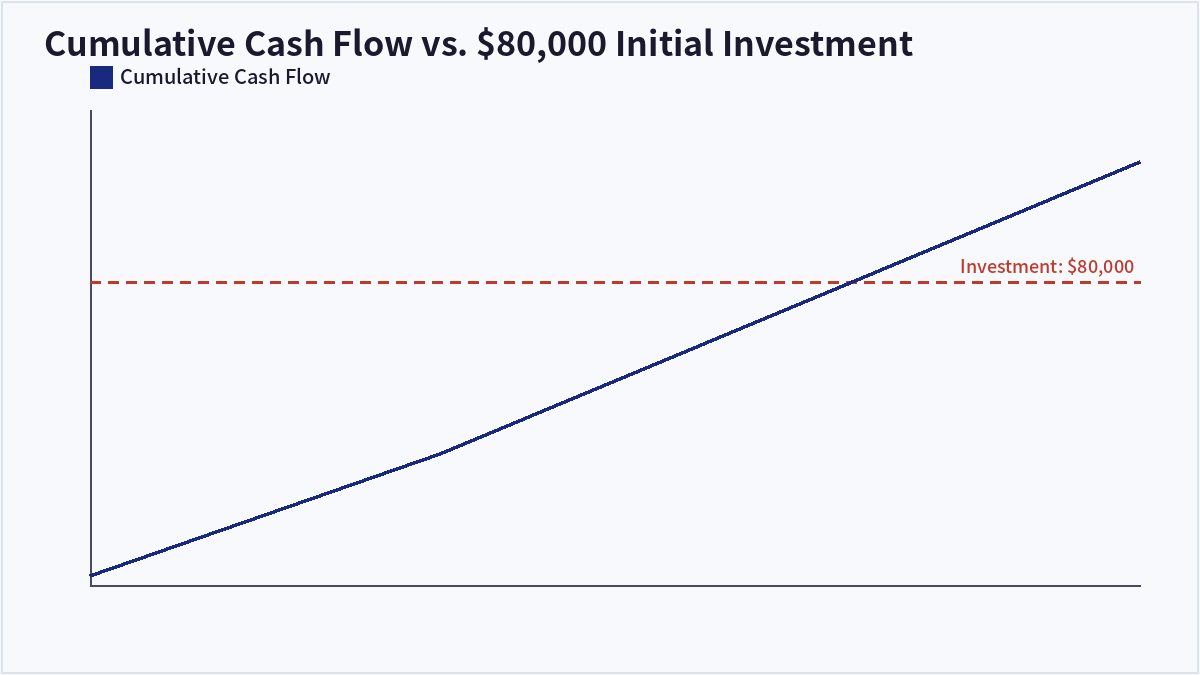
Consider a project requiring an initial investment of $80,000, with expected cash flows of $20,000 in Year 1, $25,000 in Year 2, $30,000 in Year 3, and $30,000 in Year 4. Cumulative cash flow reaches $20,000 after Year 1, $45,000 after Year 2, and $75,000 after Year 3, still $5,000 short of the $80,000 investment. In Year 4, the project generates $30,000, so only $5,000 of that $30,000 is needed to finish recovering the investment: $5,000 / $30,000 = 0.17, meaning the payback period is approximately 3.17 years, or about 3 years and 2 months.
The Discounted Payback Period
A key weakness of the simple payback period is that it treats a dollar received in Year 4 as equal to a dollar received in Year 1, ignoring the time value of money. The discounted payback period fixes this by discounting each year’s cash flow before accumulating it. Using the same cash flows discounted at 10%, the present values are $18,182 in Year 1, $20,661 in Year 2, $22,539 in Year 3, and $20,491 in Year 4. Cumulative discounted cash flow reaches $61,382 after Year 3, still $18,618 short of $80,000; dividing that gap by Year 4’s discounted cash flow of $20,491 gives 0.91, so the discounted payback period comes out to approximately 3.91 years, about nine months longer than the simple 3.17-year figure.
Strengths and Limitations
The payback period’s main strength is simplicity and its direct read on how long capital is at risk, which is why many companies still use it as an initial screening step, particularly for projects with high uncertainty or in industries where fast capital recovery matters strategically. Its main limitations are that the simple version ignores the time value of money entirely, and both versions ignore any cash flows that occur after the payback point is reached, which means two projects with identical payback periods can have very different total value.
| Feature | Payback Period | Discounted Payback Period |
|---|---|---|
| Time value of money | Ignored | Incorporated via a discount rate |
| Calculation basis | Raw, undiscounted cash flows | Present-valued cash flows |
| Typical result | Shorter, less conservative | Longer, more conservative |
| Result in this example | 3.17 years | 3.91 years (at a 10% discount rate) |
Frequently Asked Questions
What is considered a “good” payback period?
There is no universal threshold; it depends on the industry, the asset’s useful life, and the company’s risk tolerance. A company might set a target such as “recover the investment within 3 years” for a piece of equipment expected to last 10 years, but that target is a policy choice, not a rule derived from the payback formula itself.
Why do companies still use payback period if NPV is more accurate?
Payback period is fast to calculate, easy to communicate, and gives a direct sense of how long capital is tied up and exposed to risk, which NPV does not directly convey. Many companies use it as a first screen to eliminate weak candidates quickly, then apply NPV or IRR to the projects that pass that initial filter.
Does a shorter payback period always mean a better investment?
Not necessarily. A shorter payback period reduces the time capital is at risk, but it says nothing about the total value created over the investment’s full life. A project with a longer payback period but strong cash flows in later years can have a much higher NPV than a project that pays back quickly and then generates little afterward.
How does payback period differ from break-even analysis?
Payback period measures how long it takes to recover a specific capital investment through project-level cash flows. Break-even analysis, by contrast, typically measures the sales volume or revenue level at which a business or product line’s total revenue equals its total costs. They address related but distinct questions about capital recovery versus operational profitability.
Key Takeaways
The payback period measures how quickly an investment returns its initial cost in cash, offering a simple, intuitive gauge of capital-recovery speed and liquidity risk. Its discounted version corrects for the time value of money but takes longer to reach the same recovery point, as shown in the 3.17-year versus 3.91-year comparison above, and neither version captures value created after the payback point, which is why payback period works best alongside NPV and IRR rather than as a standalone decision tool. This article is for informational purposes only and does not constitute investment advice.

QuantPro: AI Finds the Trade Before You Do
From AI-powered chart analysis to real-time market intelligence — everything a serious investor needs, in one platform.
- Automated AI chart analysis with precision trend timing
- Bull Radar: real-time visualization of geopolitical & economic shifts
- Live market-moving news and insights, curated for you

Bull Wave / Bear Wave Forecast Model
Engineered to help you read market direction and momentum faster than the crowd.
- Instantly separate bullish momentum from bearish pressure
- Pinpoint high-probability entry zones with confidence
- Chart signals clear enough for beginners, sharp enough for pros

Winning Pattern Detection
Instantly surfaces the high-probability setups that repeat across the charts — a trusted edge for timing your entries and exits.
- Spot momentum building in real time
- Catch trend-reversal points before they break
- Built for active traders who need results, not theory

AI Live Economic Dashboard
AI analyzes real-time market data — turning complex, global investment flows into clear insight in seconds.
- Track global stock markets in real time
- See exactly which assets are strong — and which are fading
- Watch how geopolitical events move the markets
About the Author