What Is the Phillips Curve?
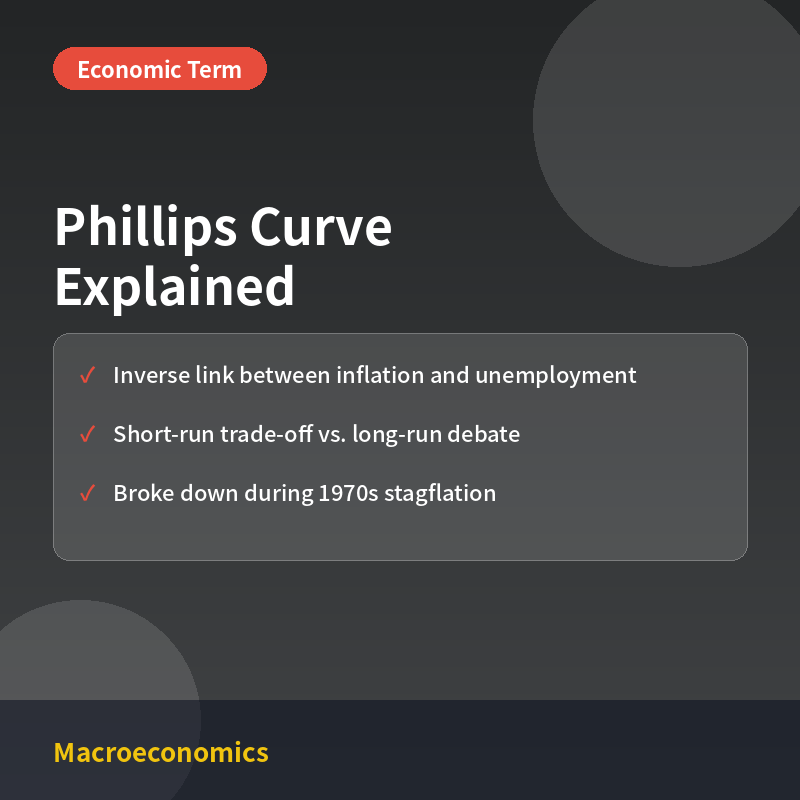
The Phillips Curve is an economic model describing an observed inverse relationship between the rate of unemployment and the rate of inflation in an economy: historically, periods of low unemployment have tended to coincide with higher inflation, and periods of high unemployment with lower inflation. The relationship is named after economist A.W. Phillips, who in 1958 documented an inverse relationship between unemployment and wage inflation in the United Kingdom using data spanning nearly a century.
The intuitive mechanism behind the curve is labor market tightness: when unemployment is low, employers compete harder for scarce workers, pushing wages up faster, and those higher labor costs tend to feed through into higher prices economy-wide. When unemployment is high, workers have less bargaining power, wage growth slows, and inflationary pressure eases.
Short-Run vs. Long-Run Phillips Curve
The original Phillips Curve described a stable, downward-sloping trade-off: policymakers could choose a point on the curve, accepting somewhat higher inflation to buy lower unemployment, or vice versa. Economists Milton Friedman and Edmund Phelps challenged this in the late 1960s, arguing that the trade-off only holds in the short run, when inflation expectations lag behind actual inflation. Over the long run, they argued, workers and firms adjust their expectations, and unemployment settles back at a structural “natural rate” (also called the Non-Accelerating Inflation Rate of Unemployment, or NAIRU) regardless of the inflation rate, making the long-run Phillips Curve vertical rather than downward-sloping.
The 1970s Stagflation Break
The clearest historical challenge to the simple Phillips Curve came in the 1970s, when many advanced economies experienced stagflation: simultaneously high inflation and high unemployment, a combination the original downward-sloping curve did not predict. Oil price shocks and rising inflation expectations are widely credited as key drivers, and the episode strongly shaped the shift toward the expectations-augmented, natural-rate framework used by most central banks today.
The Phillips Curve in Recent Economic Data
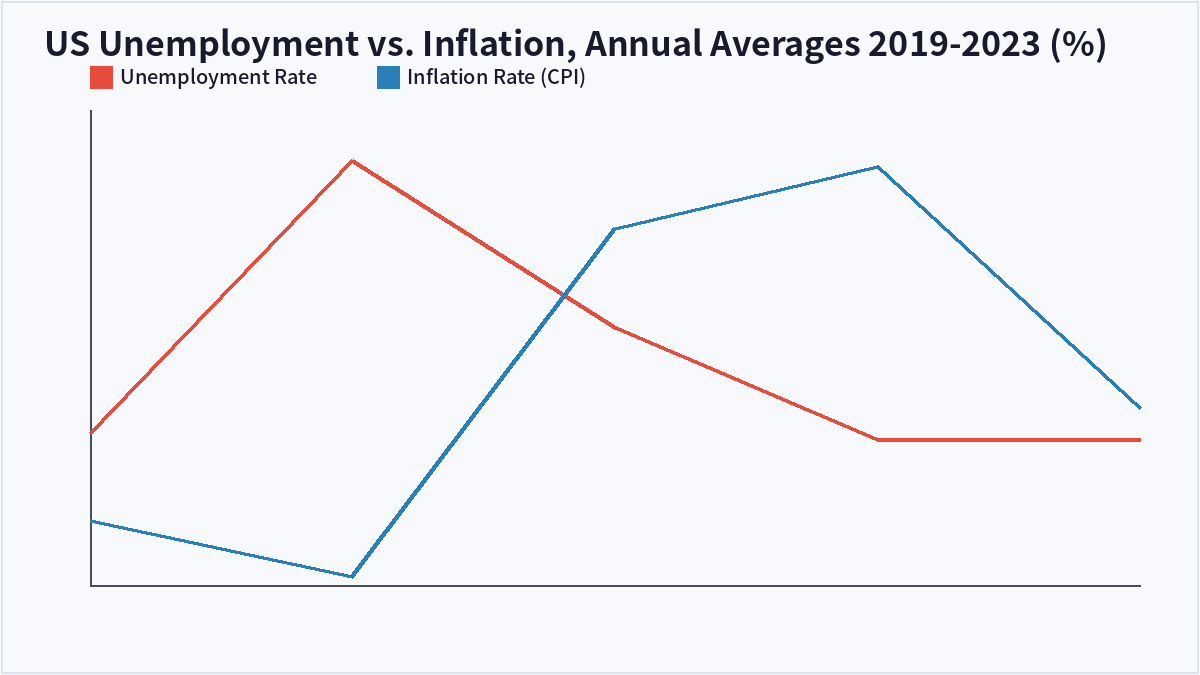
More recent US data illustrates both the trade-off and its limits. Annual average unemployment fell from about 8.1% in 2020, the pandemic-driven peak, to roughly 3.6% by 2022, while CPI inflation rose from about 1.4% to roughly 8.0% over the same period, broadly consistent with the inverse relationship the curve describes. But the relationship is not mechanical: 2021’s jump in inflation to around 7.0% coincided with unemployment still well above its pre-pandemic low, a pattern many economists attribute partly to pandemic-era supply-chain disruptions rather than a pure labor-market trade-off, underscoring that the Phillips Curve is a useful conceptual relationship rather than a precise, mechanical forecasting tool.
Why the Phillips Curve Matters for Policy
Central banks use the Phillips Curve framework, in modified and expectations-augmented forms, as one input for thinking about how aggressively to raise or lower interest rates in response to labor market conditions. A steep, reliable trade-off would imply large inflation costs to further reducing unemployment; a flat or unstable relationship, which many economists argue has characterized recent decades, implies that unemployment can fall substantially without triggering outsized inflation, though this remains an area of active debate and periodic reassessment.
| Aspect | Short-Run Phillips Curve | Long-Run Phillips Curve |
|---|---|---|
| Shape | Downward-sloping | Vertical at the natural rate (NAIRU) |
| Trade-off implied | Lower unemployment achievable with higher inflation | No permanent trade-off; unemployment returns to its natural rate |
| Role of expectations | Assumed to lag actual inflation | Fully adjust to actual inflation over time |
| Policy implication | Temporary stimulus can lower unemployment | Persistent stimulus mainly raises inflation, not employment |
Frequently Asked Questions
Is the Phillips Curve still considered valid today?
Most economists view it as a useful but imperfect and unstable relationship rather than a fixed law. Many studies suggest the curve has flattened in recent decades, meaning unemployment now moves with smaller corresponding changes in inflation than it did in earlier periods, though opinions and estimates vary and the relationship can shift with the broader economic environment.
What is the natural rate of unemployment (NAIRU)?
NAIRU stands for the Non-Accelerating Inflation Rate of Unemployment: the theoretical unemployment rate consistent with stable, non-accelerating inflation. Below NAIRU, inflation is theorized to accelerate; above it, inflation is theorized to decelerate. It is an estimated, not directly observable, figure that economists and central banks update over time.
What caused the Phillips Curve to break down in the 1970s?
Oil price shocks, rising and increasingly unanchored inflation expectations, and structural changes in labor markets are commonly cited as the main drivers of 1970s stagflation, which produced simultaneously high inflation and high unemployment, a combination inconsistent with the original, simple downward-sloping curve.
How do central banks use the Phillips Curve in practice?
Central banks generally use expectations-augmented versions of the Phillips Curve as one of several inputs, alongside measures of labor market slack, wage growth, and inflation expectations, when assessing how much room exists to pursue low unemployment without triggering excessive inflation. It informs the general direction of policy rather than serving as a precise numerical target.
Key Takeaways
The Phillips Curve describes an observed, historically inverse relationship between unemployment and inflation, strongest as a short-run phenomenon and much weaker or absent as a long-run, structural trade-off once inflation expectations fully adjust. The 1970s stagflation episode and more recent data both show the relationship is directionally useful but far from mechanical, which is why it remains one input among several in modern monetary policy analysis rather than a precise forecasting rule. This article is for informational purposes only and does not constitute investment advice.

QuantPro: AI Finds the Trade Before You Do
From AI-powered chart analysis to real-time market intelligence — everything a serious investor needs, in one platform.
- Automated AI chart analysis with precision trend timing
- Bull Radar: real-time visualization of geopolitical & economic shifts
- Live market-moving news and insights, curated for you
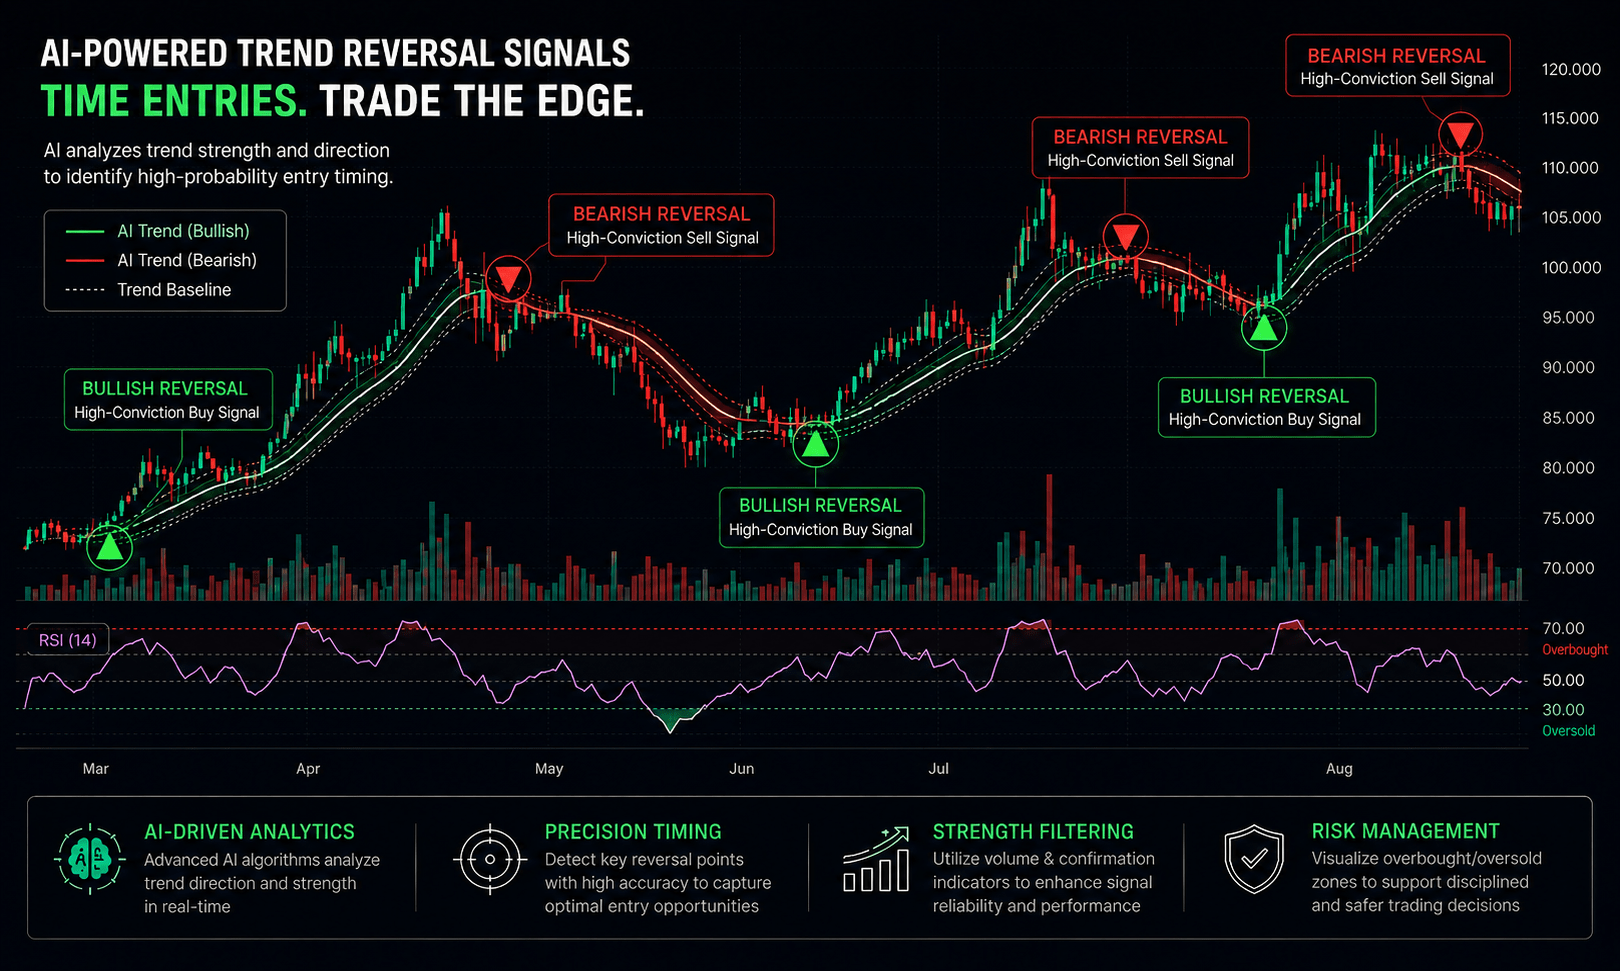
Bull Wave / Bear Wave Forecast Model
Engineered to help you read market direction and momentum faster than the crowd.
- Instantly separate bullish momentum from bearish pressure
- Pinpoint high-probability entry zones with confidence
- Chart signals clear enough for beginners, sharp enough for pros
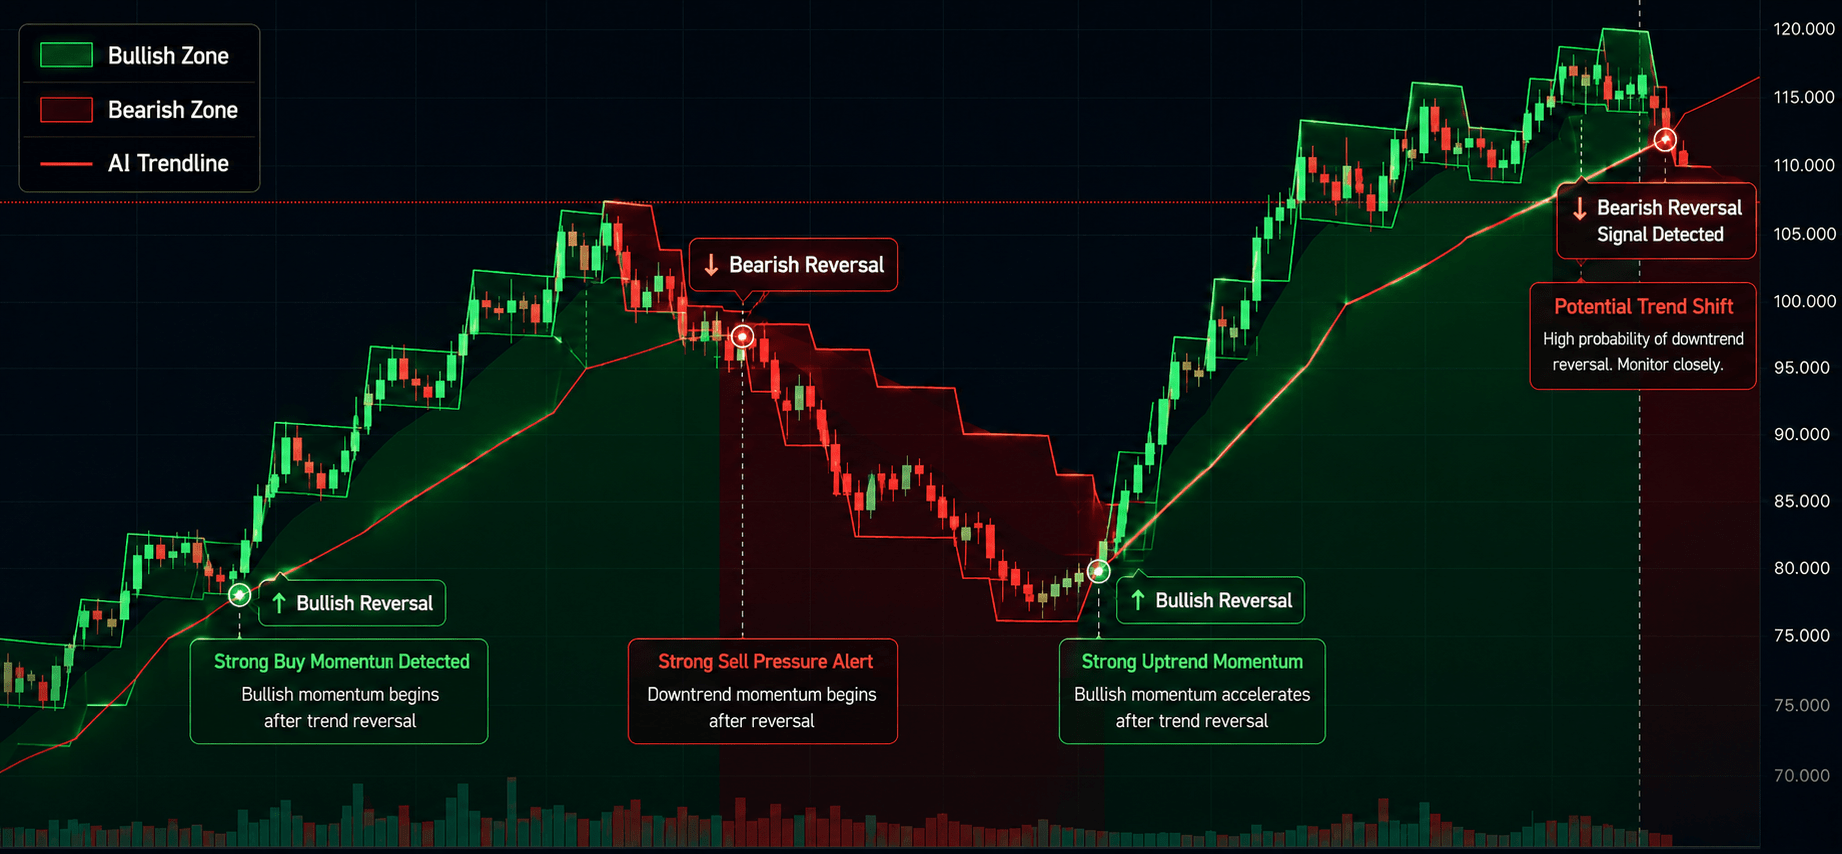
Winning Pattern Detection
Instantly surfaces the high-probability setups that repeat across the charts — a trusted edge for timing your entries and exits.
- Spot momentum building in real time
- Catch trend-reversal points before they break
- Built for active traders who need results, not theory

AI Live Economic Dashboard
AI analyzes real-time market data — turning complex, global investment flows into clear insight in seconds.
- Track global stock markets in real time
- See exactly which assets are strong — and which are fading
- Watch how geopolitical events move the markets
About the Author