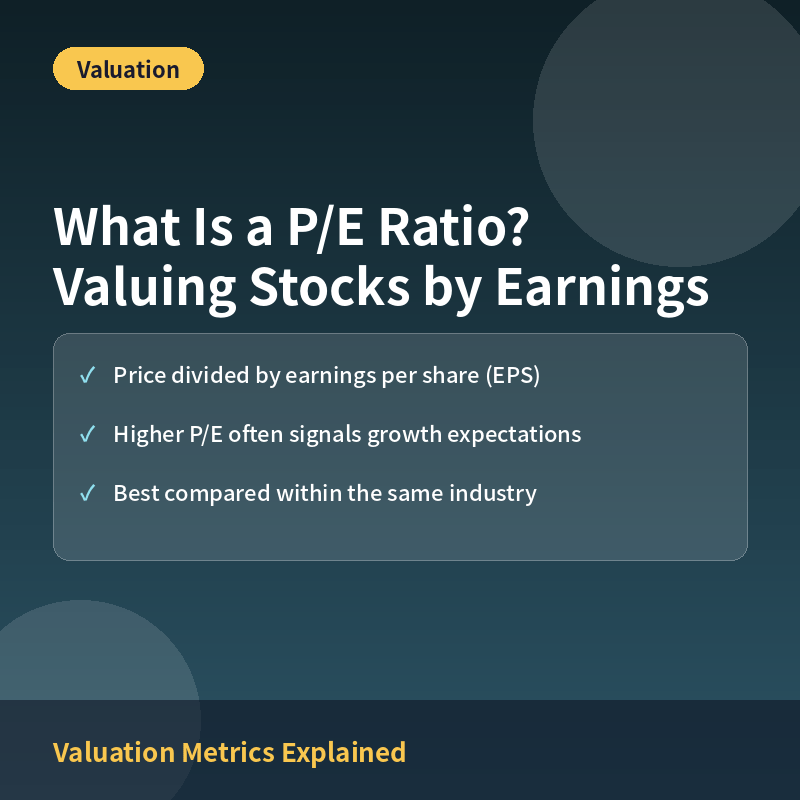
What Is a P/E Ratio
The price-to-earnings (P/E) ratio measures how much investors are willing to pay for each dollar of a company’s earnings. It is one of the most widely used tools for judging whether a stock looks expensive or cheap relative to its profits.
How to Calculate the P/E Ratio
The formula is P/E = Share Price ÷ Earnings Per Share (EPS). If a stock trades at $100 and its EPS is $5, the P/E ratio is 20, meaning investors are paying $20 for every $1 of annual earnings.
Example Across Price Levels
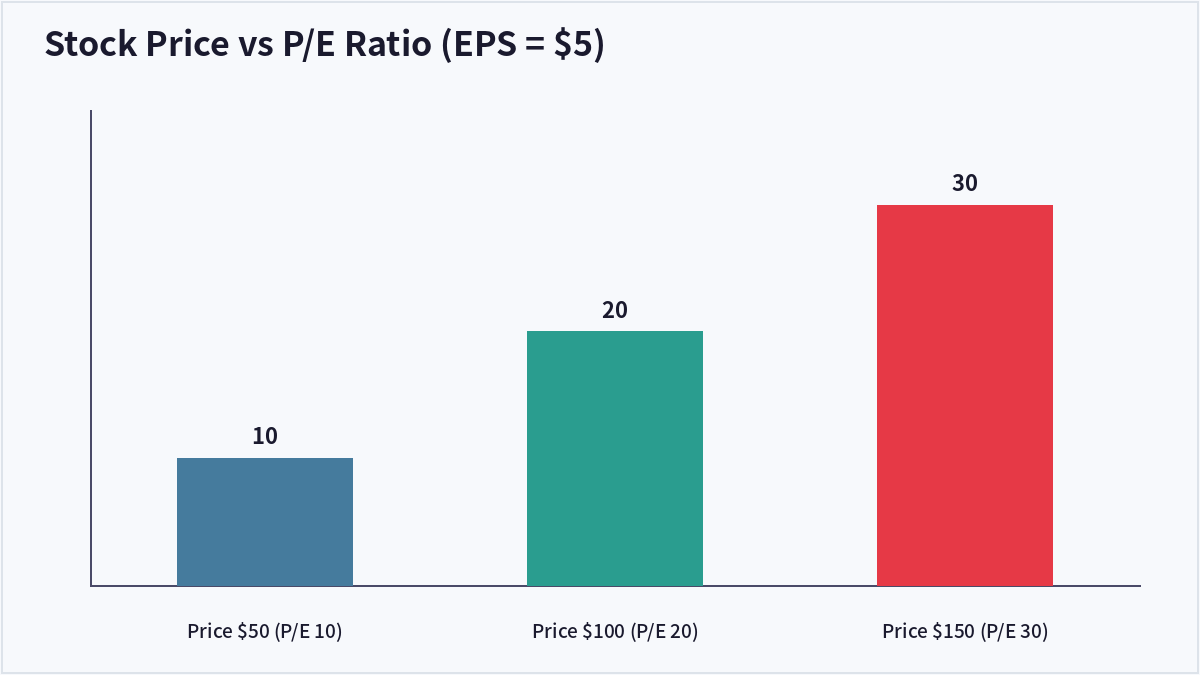
Holding EPS constant at $5, a $50 share price produces a P/E of 10, a $100 share price produces a P/E of 20, and a $150 share price produces a P/E of 30 — illustrating how price alone drives the ratio when earnings stay fixed.
How to Interpret High vs Low P/E
A high P/E often reflects strong expected earnings growth, while a low P/E can signal either an undervalued stock or genuine concerns about the company’s future. Comparing P/E ratios within the same industry generally gives more meaningful context than comparing across unrelated sectors.
Limitations of the P/E Ratio
The P/E ratio does not account for debt levels, cash reserves, or growth rates, and it becomes meaningless or misleading for companies with negative or highly volatile earnings. Metrics like PEG ratio or EV/EBITDA are often used alongside P/E for a fuller picture.
| P/E Level | Common Interpretation | Caveat |
|---|---|---|
| Low (below industry average) | Potentially undervalued | Could reflect weak growth outlook |
| Average (near industry norm) | Fairly valued relative to peers | Still requires fundamental checks |
| High (above industry average) | Growth expectations priced in | Vulnerable to earnings disappointments |
| Negative or N/A | Company has negative earnings | P/E not meaningful; use other metrics |
Frequently Asked Questions
Is a lower P/E ratio always better?
Not necessarily. A low P/E can indicate an undervalued stock, but it can also reflect genuine business risks or declining growth prospects, so it should be checked against other fundamentals.
What counts as a ‘good’ P/E ratio?
There is no universal number — it depends heavily on the industry, growth stage, and prevailing interest rate environment, so comparing a company’s P/E to its sector peers is more useful than using a fixed threshold.
What is the difference between trailing and forward P/E?
Trailing P/E uses the past 12 months of actual earnings, while forward P/E uses analysts’ projected future earnings, which can make forward P/E more forward-looking but also more uncertain.
Can the P/E ratio be negative?
Yes, when a company reports negative earnings (a net loss), the P/E ratio becomes negative or is typically reported as not applicable, since dividing by a negative number produces a figure that isn’t meaningfully interpretable.
Key Takeaways
The P/E ratio is a simple but widely used way to gauge how much investors are paying for a company’s earnings, and it works best when compared against industry peers alongside other valuation metrics. This article is for informational purposes only and does not constitute investment advice.

QuantPro: AI Finds the Trade Before You Do
From AI-powered chart analysis to real-time market intelligence — everything a serious investor needs, in one platform.
- Automated AI chart analysis with precision trend timing
- Bull Radar: real-time visualization of geopolitical & economic shifts
- Live market-moving news and insights, curated for you
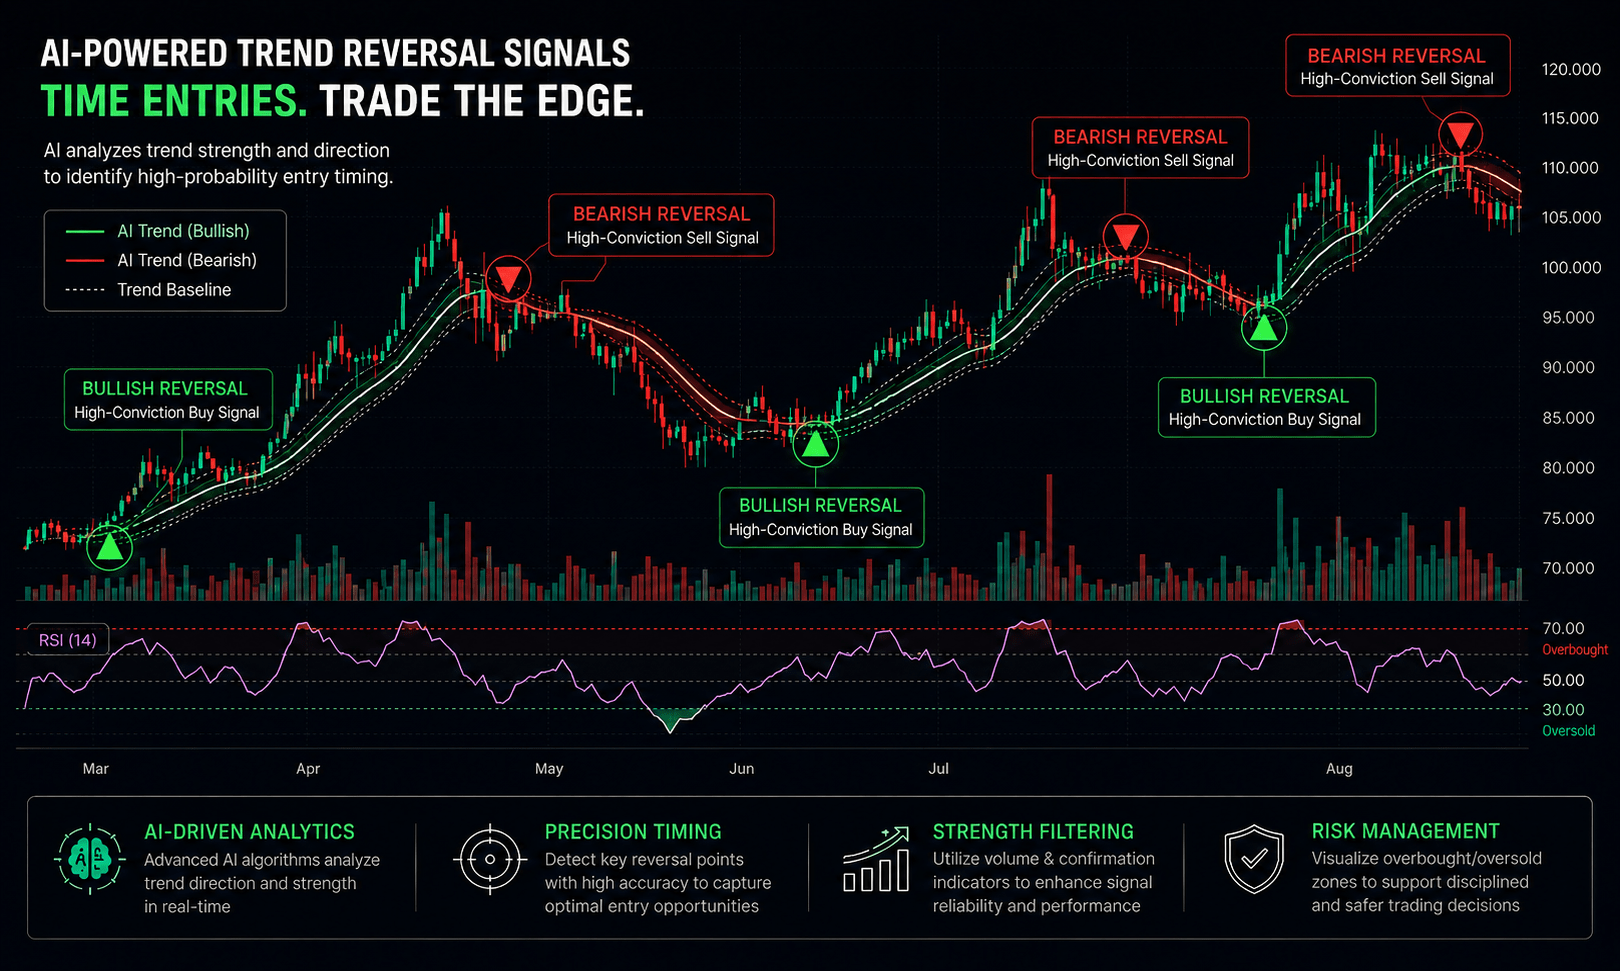
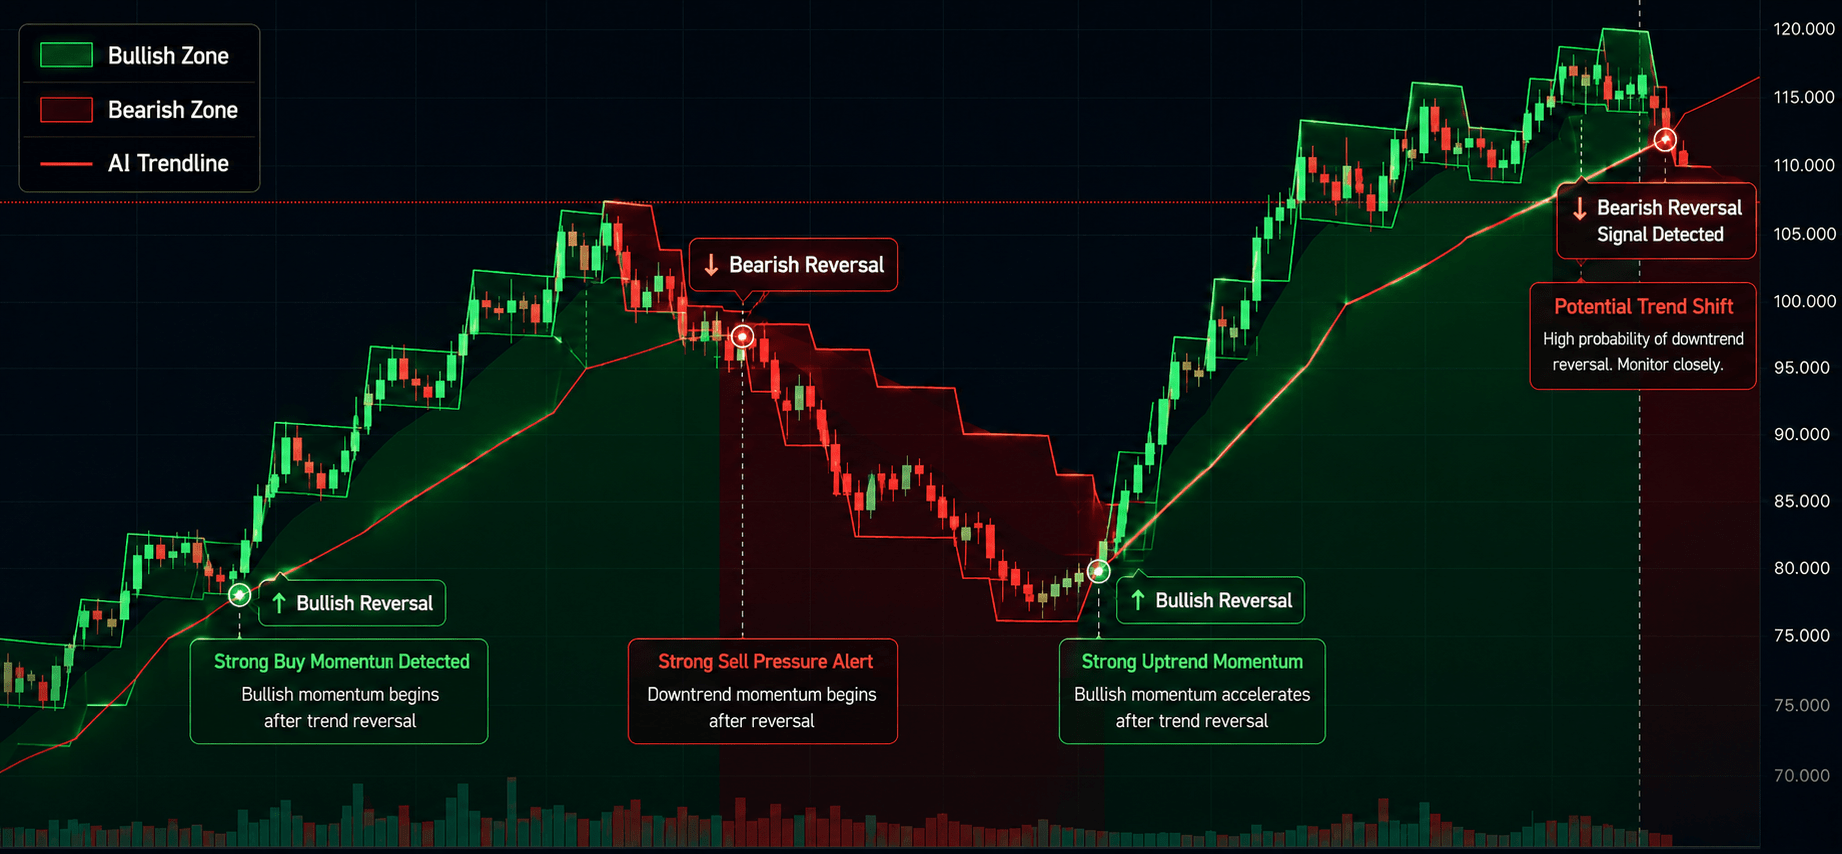
Bull Wave / Bear Wave Forecast Model
Engineered to help you read market direction and momentum faster than the crowd.
- Instantly separate bullish momentum from bearish pressure
- Pinpoint high-probability entry zones with confidence
- Chart signals clear enough for beginners, sharp enough for pros
Winning Pattern Detection
Instantly surfaces the high-probability setups that repeat across the charts — a trusted edge for timing your entries and exits.
- Spot momentum building in real time
- Catch trend-reversal points before they break
- Built for active traders who need results, not theory

AI Live Economic Dashboard
AI analyzes real-time market data — turning complex, global investment flows into clear insight in seconds.
- Track global stock markets in real time
- See exactly which assets are strong — and which are fading
- Watch how geopolitical events move the markets
About the Author