What the P/E Ratio Means
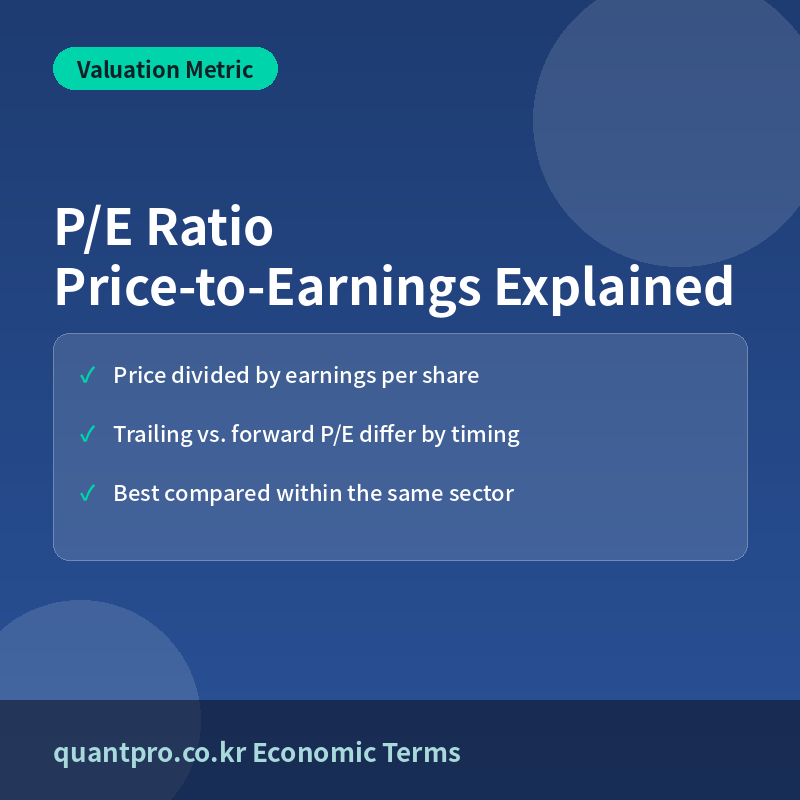
The price-to-earnings (P/E) ratio measures how much investors are willing to pay for each dollar of a company’s earnings. It is calculated as P/E = Share Price ÷ Earnings Per Share (EPS). A higher P/E generally signals that the market expects stronger future growth, while a lower P/E can indicate either an undervalued stock or genuine concerns about the company’s prospects.
Trailing P/E vs. Forward P/E
Trailing P/E uses the company’s actual earnings over the past twelve months, while forward P/E uses analysts’ projected earnings for the next twelve months. Forward P/E is more forward-looking but depends on the accuracy of earnings estimates, so comparing both versions gives a more complete picture of how the market is pricing future performance.
Why Comparing P/E Within the Same Sector Matters
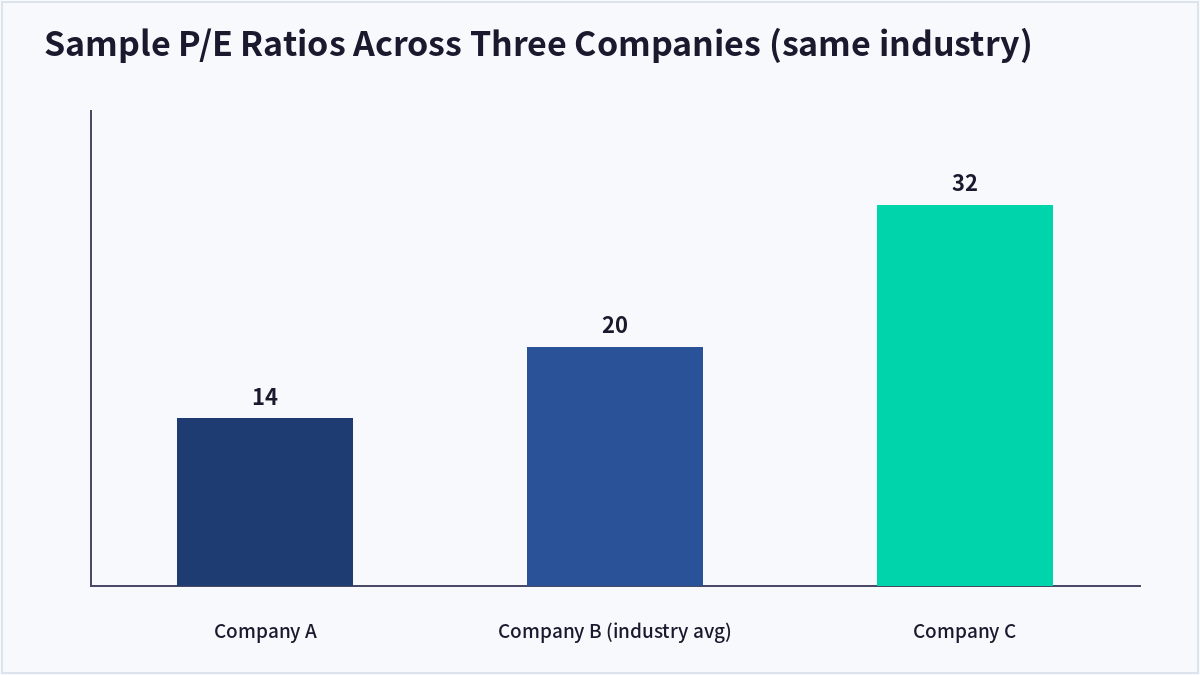
Different industries carry structurally different average P/E levels — capital-intensive sectors like utilities often trade at lower multiples than high-growth technology companies. Comparing a stock’s P/E only to peers in the same sector, rather than the market as a whole, produces a far more meaningful read on whether it is cheap or expensive.
Limitations to Keep in Mind
The P/E ratio cannot be calculated for companies with negative earnings, and it can be distorted by one-time accounting items that inflate or depress reported profit in a single period. For this reason, many investors pair P/E with other metrics such as the PEG ratio, price-to-book, or EV/EBITDA to get a fuller view of valuation.
| Metric | Formula | What It Measures |
|---|---|---|
| Trailing P/E | Price ÷ Past 12-month EPS | Valuation based on actual results |
| Forward P/E | Price ÷ Estimated next 12-month EPS | Valuation based on expected growth |
| PEG Ratio | P/E ÷ Earnings Growth Rate | Valuation adjusted for growth |
Frequently Asked Questions
Is a lower P/E ratio always better?
Not necessarily. A low P/E can signal an undervalued stock, but it can also reflect genuine concerns about slowing growth or industry decline, so it should always be checked against the company’s fundamentals and sector averages.
What is considered a ‘good’ P/E ratio?
There is no universal good number since acceptable P/E levels vary widely by industry and growth stage; comparing a company’s P/E to its historical average and to direct competitors is generally more useful than applying a single fixed benchmark.
Why can’t the P/E ratio be calculated for some companies?
When a company reports a net loss, earnings per share turns negative, which makes the P/E ratio meaningless (or undefined) — in these cases investors often turn to alternative metrics like price-to-sales instead.
How does the P/E ratio relate to the PEG ratio?
The PEG ratio divides the P/E ratio by the company’s expected earnings growth rate, adjusting for growth so that a high-P/E, high-growth stock and a low-P/E, low-growth stock can be compared on a more equal footing.
Key Takeaways
The P/E ratio compares a stock’s price to its earnings per share and remains one of the most widely used valuation benchmarks, but it is most meaningful when compared within the same industry and alongside other metrics like the PEG ratio. This article is for informational purposes only and does not constitute investment advice.

QuantPro: AI Finds the Trade Before You Do
From AI-powered chart analysis to real-time market intelligence — everything a serious investor needs, in one platform.
- Automated AI chart analysis with precision trend timing
- Bull Radar: real-time visualization of geopolitical & economic shifts
- Live market-moving news and insights, curated for you

Bull Wave / Bear Wave Forecast Model
Engineered to help you read market direction and momentum faster than the crowd.
- Instantly separate bullish momentum from bearish pressure
- Pinpoint high-probability entry zones with confidence
- Chart signals clear enough for beginners, sharp enough for pros

Winning Pattern Detection
Instantly surfaces the high-probability setups that repeat across the charts — a trusted edge for timing your entries and exits.
- Spot momentum building in real time
- Catch trend-reversal points before they break
- Built for active traders who need results, not theory

AI Live Economic Dashboard
AI analyzes real-time market data — turning complex, global investment flows into clear insight in seconds.
- Track global stock markets in real time
- See exactly which assets are strong — and which are fading
- Watch how geopolitical events move the markets
About the Author