Order Flow Analysis tracks the individual trade executions and volume at specific price levels to reveal the underlying supply and demand. By monitoring these transactions in real-time, traders can identify the presence of institutional activity and potential price reversal points before they appear on standard candlestick charts.
What is Order Flow Analysis in Crypto Trading?
Defining the Flow of Market Orders
Order Flow Analysis is a method of studying the stream of individual transactions and limit orders as they occur in the market, rather than just observing historical price movement. It provides a granular view of how buyers and sellers are interacting at specific price levels, revealing the true sentiment behind a move.
Why Depth Matters
Unlike standard chart analysis which uses time-based candles, order flow focuses on the volume of orders executed at each tick. You can analyze market imbalances and hidden liquidity traps by observing these execution patterns. For more advanced setups, you can check this metric directly on Bull Radar to see where large buy or sell walls are concentrating.
How Order Flow Analysis is Calculated and Interpreted
The Footprint Chart Mechanism
The primary tool for this analysis is the Footprint chart, which displays volume distributed at each price level within a single bar. To interpret the data, traders look for:
- Delta: The difference between market buy orders and market sell orders at a specific price.
- Imbalance: A significant difference in volume between buyers and sellers, typically identified when one side outweighs the other by a predefined percentage.
- Volume Nodes: High-volume areas where price spent significant time, indicating strong support or resistance.

QuantPro: AI Finds the Trade Before You Do
From AI-powered chart analysis to real-time market intelligence — everything a serious investor needs, in one platform.
- Automated AI chart analysis with precision trend timing
- Bull Radar: real-time visualization of geopolitical & economic shifts
- Live market-moving news and insights, curated for you

Bull Wave / Bear Wave Forecast Model
Engineered to help you read market direction and momentum faster than the crowd.
- Instantly separate bullish momentum from bearish pressure
- Pinpoint high-probability entry zones with confidence
- Chart signals clear enough for beginners, sharp enough for pros

Winning Pattern Detection
Instantly surfaces the high-probability setups that repeat across the charts — a trusted edge for timing your entries and exits.
- Spot momentum building in real time
- Catch trend-reversal points before they break
- Built for active traders who need results, not theory

AI Live Economic Dashboard
AI analyzes real-time market data — turning complex, global investment flows into clear insight in seconds.
- Track global stock markets in real time
- See exactly which assets are strong — and which are fading
- Watch how geopolitical events move the markets
Worked Example: Identifying a Reversal with Order Flow
Consider a scenario where Bitcoin is trading at $60,000.
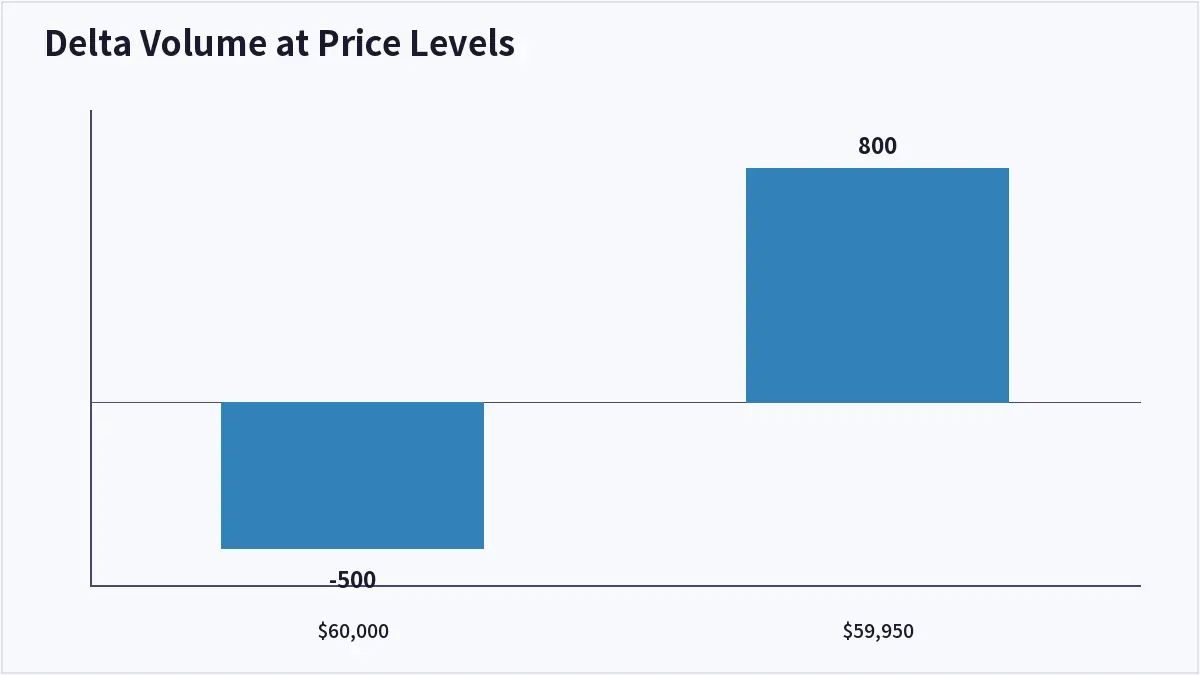
- At $60,000, the Delta shows -500 BTC, meaning sellers are aggressive.
- As the price hits $59,950, the Delta flips to +800 BTC despite the price dropping further.
- This creates a ‘Positive Delta Divergence’, suggesting that passive limit buy orders are absorbing the aggressive selling pressure.
- Traders interpret this as a potential floor, as the absorption indicates that the selling supply is being exhausted by institutional-sized buying orders at that support level.
Common Mistakes and Misconceptions
Over-relying on Short-term Noise
A common mistake is assuming that every order flow spike leads to an immediate price trend. Order flow is highly sensitive to noise, and it must be paired with macro context or higher-timeframe trends to avoid ‘whipsaws’.
- Do not assume high volume always means a trend continuation.
- A large spike in sell volume at a support level could mean a breakout or could be a ‘trap’ where liquidations occur.
- Always verify volume data against order book depth to ensure the liquidity isn’t being spoofed.
| Indicator Type | Focus | Primary Utility | Difficulty Level |
|---|---|---|---|
| Candlestick Analysis | Price/Time | Trend Identification | Low |
| Order Flow | Volume/Price | Execution/Absorption | High |
Frequently Asked Questions
Do I need specialized software for Order Flow Analysis?
Yes, standard exchange charts typically only show price and basic volume. You need platforms that support Footprint or Delta charts to view the internal transaction data.
Is Order Flow Analysis effective for long-term investing?
Order flow is primarily a short-term trading tool focused on entry and exit precision. It is less useful for long-term fundamental analysis of a project.
What is a ‘delta’ in crypto trading?
Delta is the net difference between market buy orders and market sell orders. A positive delta indicates aggressive buying, while a negative delta indicates aggressive selling.
Can order flow prevent me from getting liquidated?
While it can help you identify support and resistance more accurately, it does not prevent liquidation. Proper position sizing and stop-loss management remain essential to manage risk.
Key Takeaways
Order Flow Analysis transforms raw transaction data into a readable map of market pressure. By focusing on volume distribution and delta changes rather than just price, traders can spot institutional absorption and exhaustion signals that are invisible on standard charts. Use this method to refine your entry points, but always combine it with broader risk management and trend analysis to navigate crypto’s high volatility. This article is for informational purposes only and does not constitute investment advice.
Last updated: 2026-09-18
About the Author