What Are Bollinger Bands
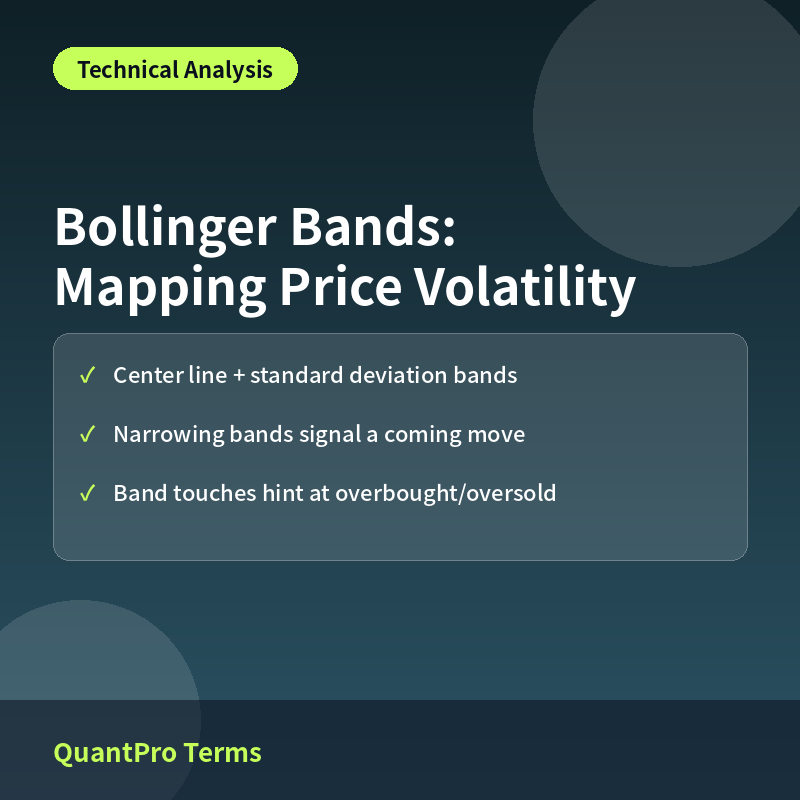
Bollinger Bands plot a moving average (typically 20-day) as a center line, with an upper band and lower band drawn a set number of standard deviations (typically 2) above and below it, visually mapping the expected range of price movement. The indicator is named after its creator, John Bollinger.
Statistically, prices are expected to stay within the upper and lower bands roughly 95% of the time when using a 2-standard-deviation setting, which means moves outside the bands are considered statistically unusual.
What Band Width Tells You
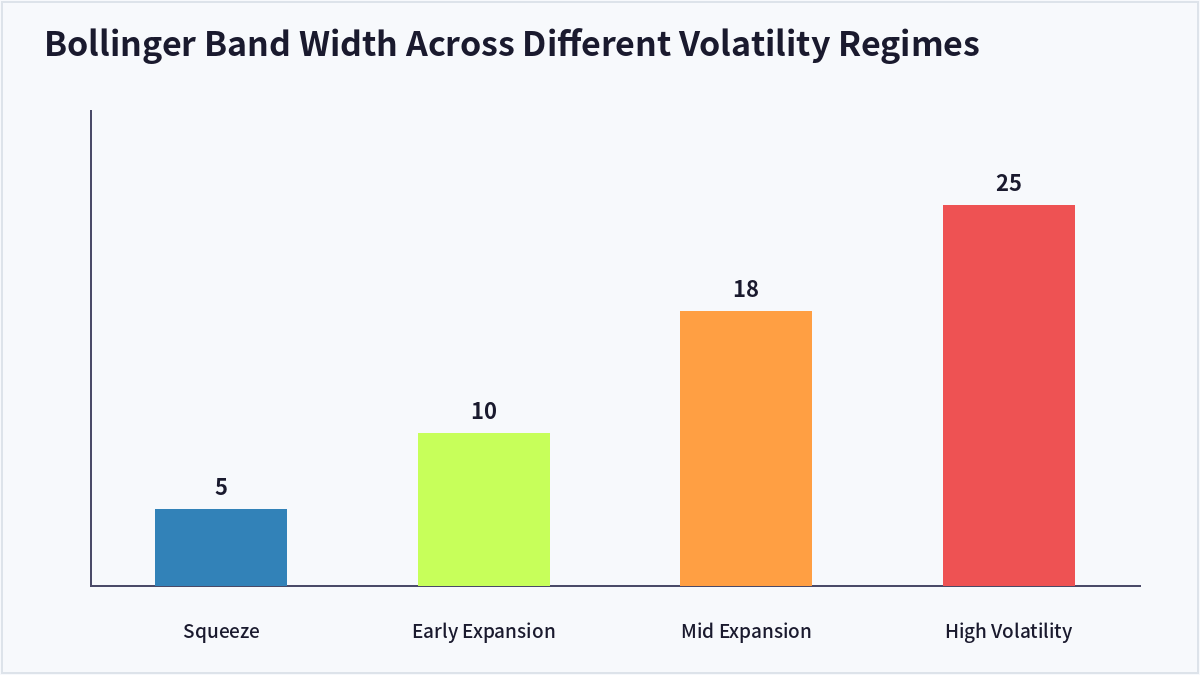
The distance between the upper and lower bands — the ‘band width’ — directly reflects current volatility. Bands widen as volatility rises and narrow as volatility falls. An especially tight band width is called a ‘squeeze,’ and it’s often interpreted as a sign that a larger price move, in either direction, may be approaching.
In a real sequence, band width might sit around 5% during a low-volatility period, then expand to 10%, 18%, and 25% as volatility picks up — a pattern that frequently follows a squeeze and confirms the classic setup.
How to Use Bollinger Bands
The basic interpretation is that a price approaching or touching the upper band may indicate short-term overbought conditions, while a price near the lower band may indicate short-term oversold conditions. In strong trends, however, prices can ‘walk the band’ — hugging the upper band and continuing to climb — so a band touch alone shouldn’t be read as an automatic reversal signal without considering trend strength.
Bollinger Bands are often paired with momentum indicators like RSI or MACD to improve the reliability of overbought/oversold readings, and watching which direction the bands expand after a squeeze can offer clues about the likely direction of the next move.
| Zone | Interpretation |
|---|---|
| Touching upper band | Possible short-term overbought; watch for band-walking in strong trends |
| Near center line (MA) | Neutral, range-bound behavior |
| Touching lower band | Possible short-term oversold |
| Band squeeze | Signals a larger move may be approaching |
Frequently Asked Questions
Should I always sell when price touches the upper band?
Not necessarily — in strong uptrends, prices can ‘walk’ along the upper band for an extended period, so it’s better to consider trend strength alongside the band touch rather than treating it as an automatic sell signal.
Does a squeeze always lead to a rally?
A squeeze signals that a bigger move is likely coming, but it doesn’t indicate the direction. The actual direction is usually confirmed by watching which way the bands expand once the squeeze resolves.
Can I adjust the standard deviation multiplier?
Yes — the default is 2 standard deviations, but some traders widen it to 2.5 for fewer signals or tighten it to 1.5 for more sensitivity, depending on their trading style.
What kind of markets suit Bollinger Bands best?
Stocks or indices that regularly cycle between periods of expanding and contracting volatility tend to produce the most useful signals; very low-volatility names generate less meaningful band-width changes.
Key Takeaways
Bollinger Bands plot a moving average with volatility-based upper and lower bands, visualizing both the expected price range and potential overbought or oversold conditions. Watching how band width expands and contracts is especially useful for anticipating shifts in volatility. This article is for informational purposes only and does not constitute investment advice.

QuantPro: AI Finds the Trade Before You Do
From AI-powered chart analysis to real-time market intelligence — everything a serious investor needs, in one platform.
- Automated AI chart analysis with precision trend timing
- Bull Radar: real-time visualization of geopolitical & economic shifts
- Live market-moving news and insights, curated for you

Bull Wave / Bear Wave Forecast Model
Engineered to help you read market direction and momentum faster than the crowd.
- Instantly separate bullish momentum from bearish pressure
- Pinpoint high-probability entry zones with confidence
- Chart signals clear enough for beginners, sharp enough for pros

Winning Pattern Detection
Instantly surfaces the high-probability setups that repeat across the charts — a trusted edge for timing your entries and exits.
- Spot momentum building in real time
- Catch trend-reversal points before they break
- Built for active traders who need results, not theory

AI Live Economic Dashboard
AI analyzes real-time market data — turning complex, global investment flows into clear insight in seconds.
- Track global stock markets in real time
- See exactly which assets are strong — and which are fading
- Watch how geopolitical events move the markets
About the Author