What Is MACD
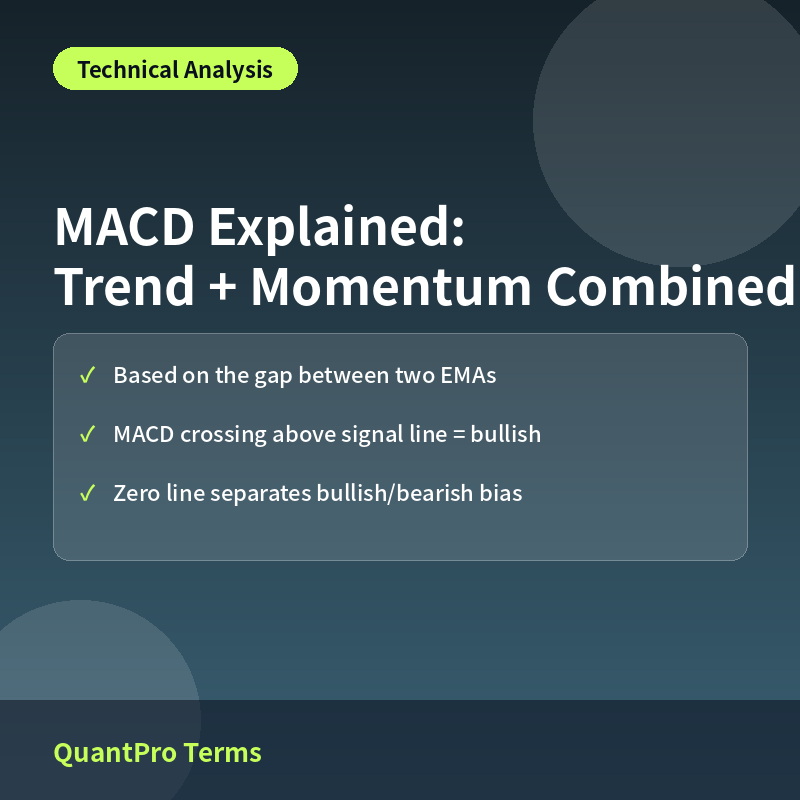
MACD (Moving Average Convergence Divergence) tracks the relationship between a short-term exponential moving average (typically 12-day) and a long-term one (typically 26-day), showing how the two converge and diverge over time to reveal both the direction and strength of a trend.
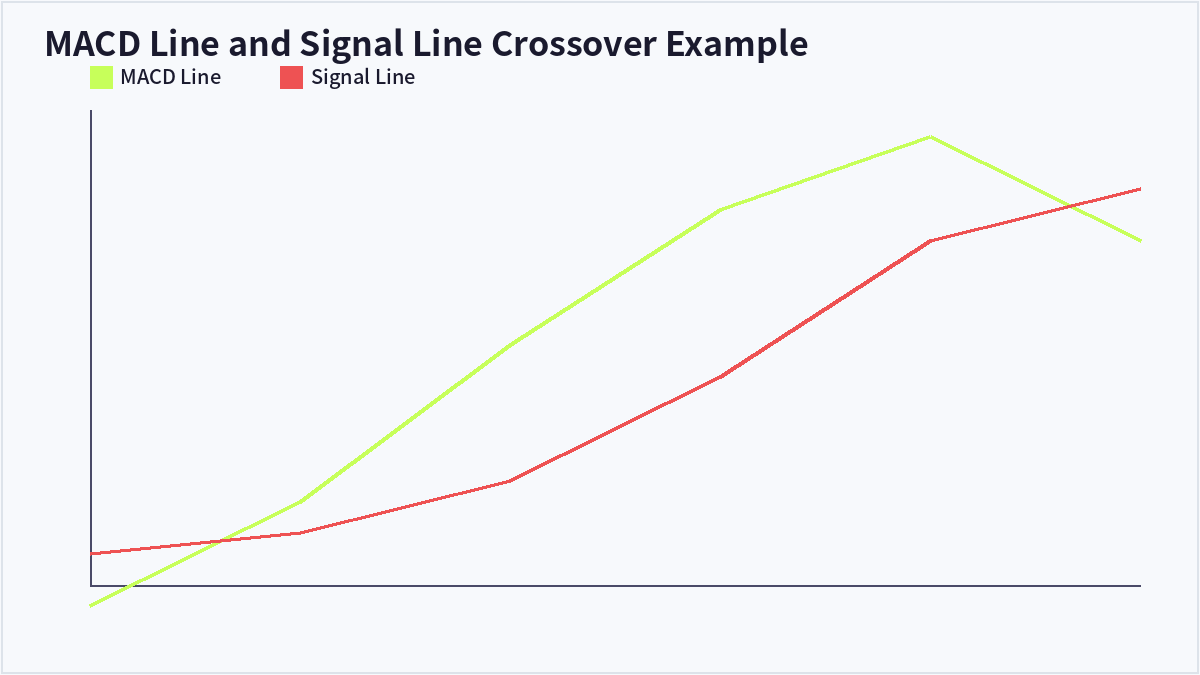
The ‘MACD line’ (the 12-day EMA minus the 26-day EMA) is plotted alongside a ‘signal line’ (a 9-day average of the MACD line itself), and traders watch how these two lines cross and diverge to time potential entries and exits.
How to Read MACD
When the MACD line crosses above the signal line, it’s read as a bullish signal suggesting strengthening upward momentum; when it crosses below, it’s read as a bearish signal suggesting strengthening downward momentum. This is conceptually similar to a golden cross or death cross in moving averages, but MACD reacts to changes in the gap between averages rather than to price itself, making it somewhat more sensitive to shifting momentum.
When the MACD line sits above the zero line, it suggests short-term momentum is outpacing the longer-term trend (a bullish bias); below zero suggests the opposite. The wider the gap between the MACD line and signal line, the stronger the underlying momentum is considered to be.
Practical Tips for Using MACD
Because MACD is built on moving averages, it remains a lagging indicator, and choppy or range-bound markets can generate frequent crossovers that turn out to be false signals — commonly called ‘whipsaws.’ Watching the MACD histogram, which plots the difference between the MACD and signal lines as bars, can help confirm whether momentum is genuinely shifting direction.
Like RSI, MACD tends to work best when cross-checked against volume, trendlines, or other indicators rather than used in isolation.
| Signal | Condition | Interpretation |
|---|---|---|
| Bullish crossover | MACD line crosses above signal line | Strengthening upward momentum |
| Bearish crossover | MACD line crosses below signal line | Strengthening downward momentum |
| Zero-line crossover | MACD line moves above zero | Short-term trend outpacing long-term |
Frequently Asked Questions
Is MACD the same signal as a moving average golden cross?
They’re conceptually similar but calculated differently — a moving average golden cross tracks the price averages themselves, while MACD tracks the difference between those averages, which often makes it react a bit more quickly.
What does the MACD histogram show?
It plots the MACD line minus the signal line as bars, letting traders visually gauge the strength and direction of momentum shifts through the bars’ length and direction changes.
Why is MACD less reliable in range-bound markets?
Without a clear trend, the MACD line and signal line tend to cross frequently, generating a higher number of false signals, which reduces the indicator’s reliability in choppy conditions.
Can I adjust MACD’s default settings (12, 26, 9)?
Yes — the defaults are widely tested standards, but shortening the periods increases sensitivity while lengthening them smooths the signal, and some traders adjust these to fit their trading style.
Key Takeaways
MACD tracks the relationship between short- and long-term moving averages to reveal both trend direction and momentum, with crossovers between the MACD and signal lines serving as the primary trading signals. Cross-checking with other indicators helps reduce the risk of acting on false signals. This article is for informational purposes only and does not constitute investment advice.

QuantPro: AI Finds the Trade Before You Do
From AI-powered chart analysis to real-time market intelligence — everything a serious investor needs, in one platform.
- Automated AI chart analysis with precision trend timing
- Bull Radar: real-time visualization of geopolitical & economic shifts
- Live market-moving news and insights, curated for you

Bull Wave / Bear Wave Forecast Model
Engineered to help you read market direction and momentum faster than the crowd.
- Instantly separate bullish momentum from bearish pressure
- Pinpoint high-probability entry zones with confidence
- Chart signals clear enough for beginners, sharp enough for pros

Winning Pattern Detection
Instantly surfaces the high-probability setups that repeat across the charts — a trusted edge for timing your entries and exits.
- Spot momentum building in real time
- Catch trend-reversal points before they break
- Built for active traders who need results, not theory

AI Live Economic Dashboard
AI analyzes real-time market data — turning complex, global investment flows into clear insight in seconds.
- Track global stock markets in real time
- See exactly which assets are strong — and which are fading
- Watch how geopolitical events move the markets
About the Author