What Is the Sharpe Ratio?
Definition and Financial Purpose
Developed by Nobel laureate William F. Sharpe in 1966, the Sharpe Ratio evaluates an investment’s performance by adjusting for its risk. It measures the excess return earned for every unit of total volatility (risk) taken. In finance, higher total returns do not automatically translate to superior performance if those returns were achieved through extreme, unsafe volatility. The Sharpe Ratio solves this issue by standardizing performance metrics across different asset classes and portfolio strategies.
Core Components of the Metric
The Sharpe Ratio relies on three primary variables: the portfolio return, the risk-free rate of return, and the standard deviation of excess returns. The difference between the portfolio return and the risk-free rate yields the net risk premium. Dividing this premium by the standard deviation converts the return into a standardized risk-adjusted efficiency score.
How to Calculate the Sharpe Ratio
The Sharpe Ratio Formula
The standard formula for calculating the annualized Sharpe Ratio is: Sharpe Ratio = (Portfolio Return – Risk-Free Rate) / Portfolio Standard Deviation. The portfolio return represents the realized or annualized expected return. The risk-free rate is typically derived from short-term government debt, such as 3-month U.S. Treasury bills. The denominator, standard deviation, quantifies total volatility.
Practical Calculation Example
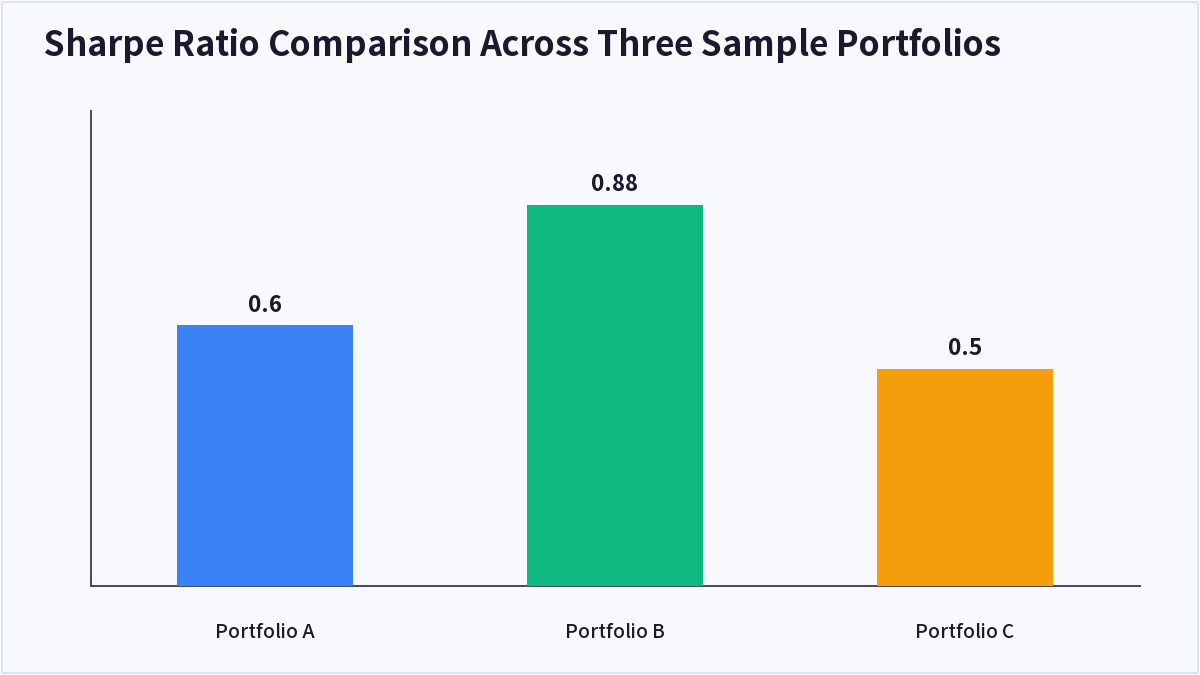
Consider three hypothetical portfolios evaluated against a 3.0% risk-free rate: Portfolio A achieves a 12.0% annual return with a standard deviation of 15.0%, resulting in a Sharpe Ratio of 0.60. Portfolio B achieves a 10.0% annual return with a standard deviation of 8.0%, resulting in a Sharpe Ratio of 0.88. Portfolio C achieves a 15.0% annual return with a standard deviation of 24.0%, resulting in a Sharpe Ratio of 0.50. Although Portfolio C delivers the highest nominal return, Portfolio B offers superior risk efficiency because it generates more excess return per unit of volatility.
Why the Sharpe Ratio Matters in Portfolio Management
Evaluating True Investment Efficiency
Evaluating fund performance solely based on percentage returns can mislead investors. An aggressive strategy might yield 20% returns while exposing capital to severe drawdowns, whereas a defensive strategy yields 12% with minimal fluctuation. The Sharpe Ratio strips away return distortion by holding strategies accountable for the total volatility they incur.
Interpreting Benchmark Thresholds
Generally, a Sharpe Ratio below 1.0 is considered sub-optimal or average. A Sharpe Ratio between 1.0 and 1.99 is categorized as good, offering solid risk-adjusted compensation. Ratios between 2.0 and 2.99 are considered very good, while scores above 3.0 represent exceptional efficiency rarely maintained over long horizons without specialized tail-risk protection.
Core Limitations of the Metric
While widely used, the Sharpe Ratio assumes that investment returns follow a normal Gaussian distribution. It treats upward volatility (gains) and downward volatility (losses) identically. Consequently, for options strategies or non-linear alternative investments with asymmetric return distributions, the Sharpe Ratio can significantly misstate true downside risk.
Sharpe Ratio vs. Sortino Ratio vs. Treynor Ratio
Comparing Risk-Adjusted Metrics
To select the appropriate analytical framework, portfolio managers often compare the Sharpe Ratio against the Sortino Ratio and Treynor Ratio. While the Sharpe Ratio measures total volatility via standard deviation, the Sortino Ratio isolates downside deviation to penalize only negative price swings. The Treynor Ratio, by contrast, uses Beta to evaluate returns against market-systematic risk rather than total volatility.
Selecting the Right Indicator
Investors analyzing balanced multi-asset portfolios should prioritize the Sharpe Ratio. Investors in growth equity or options strategies with positive upside volatility are better served by the Sortino Ratio. Institutional investors comparing well-diversified equity portfolios against a broad market index frequently rely on the Treynor Ratio.
| Metric | Risk Measure Used | Best Application | Primary Advantage |
|---|---|---|---|
| Sharpe Ratio | Total Volatility (Standard Deviation) | General multi-asset portfolios | Simple, universally recognized comparative standard |
| Sortino Ratio | Downside Deviation | Asymmetric portfolios & options strategies | Does not penalize upside volatility |
| Treynor Ratio | Systematic Risk (Beta) | Fully diversified stock portfolios | Focuses purely on market risk exposure |
Frequently Asked Questions
What is considered a good Sharpe Ratio?
A Sharpe Ratio of 1.0 or higher is generally considered good. A score above 2.0 is considered very good, and a score of 3.0 or higher is considered excellent.
Can the Sharpe Ratio be negative?
Yes. A negative Sharpe Ratio occurs when an investment’s portfolio return is lower than the prevailing risk-free rate, indicating that risk-free cash would have yielded a better return.
How does an increase in interest rates affect the Sharpe Ratio?
When central banks raise interest rates, the risk-free rate increases. Higher risk-free rates raise the hurdle rate, reducing excess returns and lowering overall Sharpe Ratios across asset classes.
What is the primary drawback of using the Sharpe Ratio?
The Sharpe Ratio treats all volatility equally. It penalizes positive price spikes (upside volatility) as harshly as price crashes (downside volatility), which can distort risk assessment for non-normal return distributions.
Key Takeaways
The Sharpe Ratio is a foundational financial metric that evaluates excess return per unit of total risk. By dividing excess return over the risk-free rate by portfolio standard deviation, investors can effectively evaluate whether high returns stem from smart asset allocation or excessive volatility. This article is for informational purposes only and does not constitute investment advice.

QuantPro: AI Finds the Trade Before You Do
From AI-powered chart analysis to real-time market intelligence — everything a serious investor needs, in one platform.
- Automated AI chart analysis with precision trend timing
- Bull Radar: real-time visualization of geopolitical & economic shifts
- Live market-moving news and insights, curated for you

Bull Wave / Bear Wave Forecast Model
Engineered to help you read market direction and momentum faster than the crowd.
- Instantly separate bullish momentum from bearish pressure
- Pinpoint high-probability entry zones with confidence
- Chart signals clear enough for beginners, sharp enough for pros

Winning Pattern Detection
Instantly surfaces the high-probability setups that repeat across the charts — a trusted edge for timing your entries and exits.
- Spot momentum building in real time
- Catch trend-reversal points before they break
- Built for active traders who need results, not theory

AI Live Economic Dashboard
AI analyzes real-time market data — turning complex, global investment flows into clear insight in seconds.
- Track global stock markets in real time
- See exactly which assets are strong — and which are fading
- Watch how geopolitical events move the markets
About the Author