What Is the Sortino Ratio?
The Sortino Ratio is a risk-adjusted return metric that measures how much excess return a portfolio generates for each unit of downside risk it takes on. Unlike broader volatility measures, it focuses exclusively on “bad” volatility — the price swings that actually hurt investors — while ignoring upside price swings entirely.
How It Differs from the Sharpe Ratio
The Sharpe Ratio divides excess return by total standard deviation, treating upside and downside volatility as equally undesirable. The Sortino Ratio refines this by replacing total standard deviation with downside deviation — the standard deviation of only the negative returns (or returns below a minimum acceptable threshold). This makes it a more accurate risk measure for investors who care about losses, not volatility in general.
How Is the Sortino Ratio Calculated?
The Formula and a Worked Example
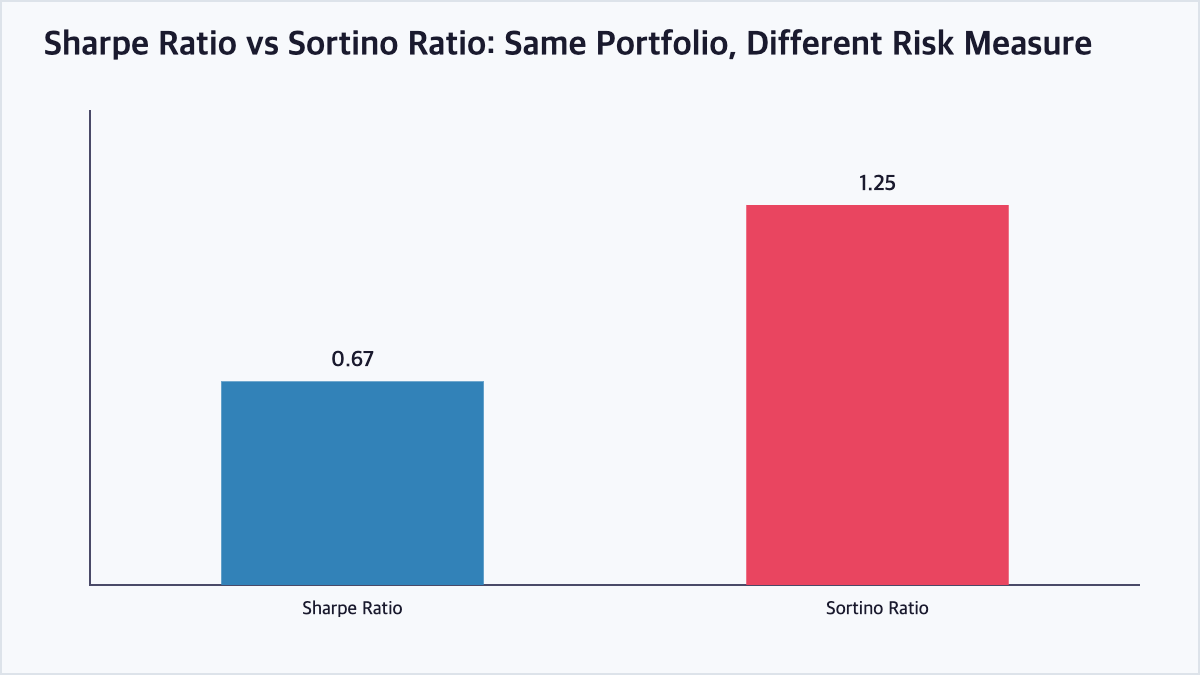
The formula is: Sortino Ratio = (Portfolio Return − Risk-Free Rate) ÷ Downside Deviation. Suppose a portfolio has an average annual return of 12%, the risk-free rate is 2%, and the downside deviation (calculated only from periods with negative or below-target returns) is 8%. The Sortino Ratio would be (12% − 2%) ÷ 8% = 1.25. If we instead calculated the Sharpe Ratio for the same portfolio using its total standard deviation of 15%, we would get (12% − 2%) ÷ 15% = 0.67 — noticeably lower, because the Sharpe Ratio penalizes upside volatility that the Sortino Ratio ignores.
Target Return (MAR) in the Denominator
Downside deviation can be measured relative to zero, to the risk-free rate, or to a custom “minimum acceptable return” (MAR) set by the investor — such as a fund’s benchmark or a required hurdle rate. Choosing a different MAR changes which returns count as “downside” and therefore changes the resulting ratio.
Why the Sortino Ratio Matters
Best Use Cases for Investors
The Sortino Ratio is especially useful for evaluating strategies with asymmetric return distributions, such as options-selling strategies, hedge funds, or trend-following systems, where large positive outliers can make the Sharpe Ratio understate true risk-adjusted performance. Investors who are primarily loss-averse — more concerned with avoiding drawdowns than with smoothing out gains — often prefer the Sortino Ratio when comparing fund managers.
| Metric | Risk Measure Used | Best For |
|---|---|---|
| Sharpe Ratio | Total standard deviation (all volatility) | Comparing portfolios with roughly symmetric return distributions |
| Sortino Ratio | Downside deviation only (negative or below-target returns) | Evaluating strategies with asymmetric or skewed returns |
| Treynor Ratio | Beta (systematic/market risk) | Comparing diversified portfolios against market risk |
Frequently Asked Questions
Why does the Sortino Ratio ignore upside volatility?
Because most investors do not consider large gains a form of risk. The Sortino Ratio is built on the premise that only downside volatility — the risk of losing money — should be penalized when judging a strategy’s risk-adjusted performance.
What counts as the minimum acceptable return (MAR)?
The MAR is a threshold chosen by the analyst — commonly zero, the risk-free rate, or a benchmark return — below which a return is treated as “downside” for the purpose of calculating downside deviation.
Can the Sortino Ratio be negative?
Yes. If a portfolio’s average return falls below the risk-free rate or chosen MAR, the numerator becomes negative, producing a negative Sortino Ratio that signals poor risk-adjusted performance.
Is a higher Sortino Ratio always better?
Generally yes, a higher Sortino Ratio indicates more return per unit of downside risk. However, it should be compared across similar strategies and time periods, since a short or unusual sample period can distort the downside deviation calculation.
Key Takeaways
The Sortino Ratio refines the Sharpe Ratio by measuring risk-adjusted return using only downside deviation, making it a better fit for strategies with skewed or asymmetric return patterns. Comparing both ratios side by side, as in the example above, reveals how much of a strategy’s apparent volatility actually comes from harmful downside moves versus welcome upside swings. This article is for informational purposes only and does not constitute investment advice.

QuantPro: AI Finds the Trade Before You Do
From AI-powered chart analysis to real-time market intelligence — everything a serious investor needs, in one platform.
- Automated AI chart analysis with precision trend timing
- Bull Radar: real-time visualization of geopolitical & economic shifts
- Live market-moving news and insights, curated for you

Bull Wave / Bear Wave Forecast Model
Engineered to help you read market direction and momentum faster than the crowd.
- Instantly separate bullish momentum from bearish pressure
- Pinpoint high-probability entry zones with confidence
- Chart signals clear enough for beginners, sharp enough for pros

Winning Pattern Detection
Instantly surfaces the high-probability setups that repeat across the charts — a trusted edge for timing your entries and exits.
- Spot momentum building in real time
- Catch trend-reversal points before they break
- Built for active traders who need results, not theory

AI Live Economic Dashboard
AI analyzes real-time market data — turning complex, global investment flows into clear insight in seconds.
- Track global stock markets in real time
- See exactly which assets are strong — and which are fading
- Watch how geopolitical events move the markets
About the Author