What Is the Price-to-Earnings (P/E) Ratio?
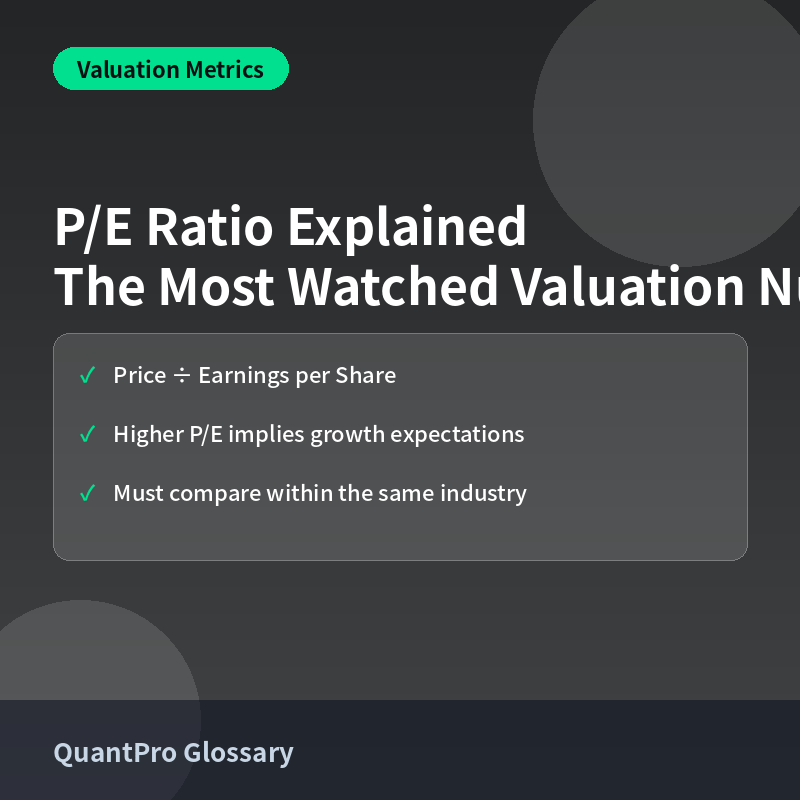
The price-to-earnings (P/E) ratio is one of the most widely used valuation metrics in investing, calculated by dividing a company’s current share price by its earnings per share (EPS). It tells investors how much they are paying for each dollar of a company’s annual earnings, offering a quick way to gauge whether a stock might be relatively expensive or cheap compared to its profitability.
How to Calculate and Interpret It
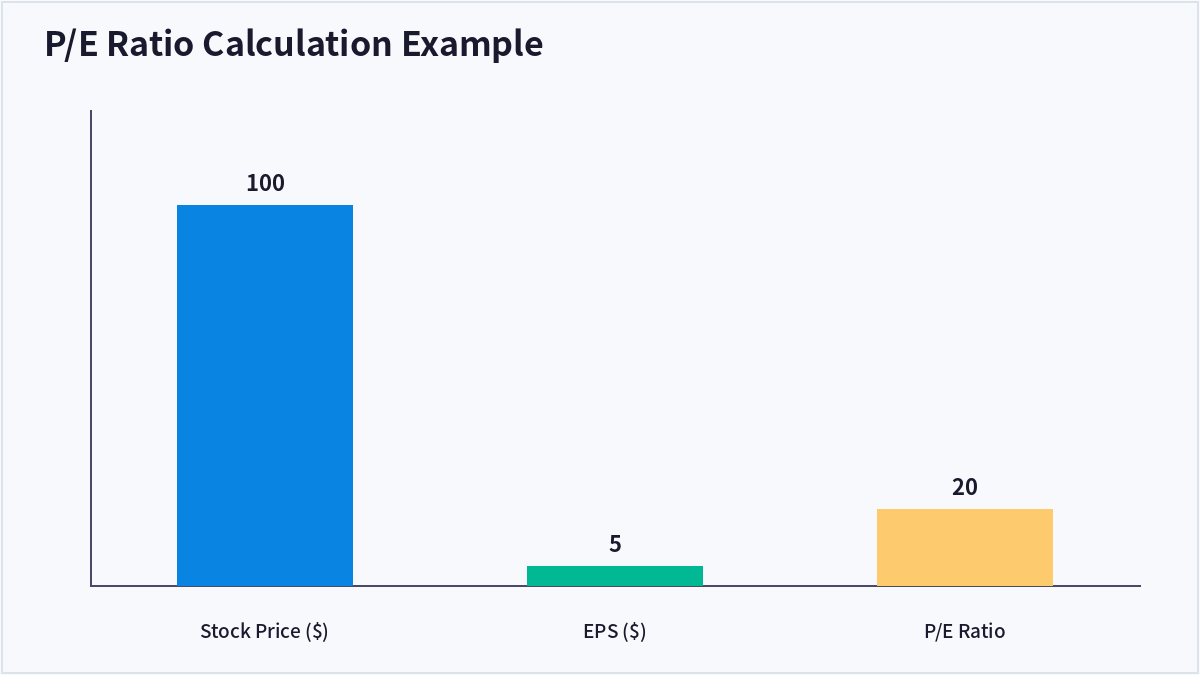
P/E Ratio = Share Price ÷ Earnings Per Share. For example, if a stock trades at $100 and its EPS over the past year was $5, the P/E ratio is 20 — meaning investors are paying $20 for every $1 of annual earnings. A higher P/E often reflects that the market expects strong future earnings growth, while a lower P/E can suggest either undervaluation or genuine concerns about the company’s growth prospects.
Trailing vs. Forward P/E
Trailing P/E Uses Historical Earnings
This is the most common form, calculated using the actual earnings reported over the trailing twelve months, giving a factual but backward-looking measure of valuation.
Forward P/E Uses Projected Earnings
This version uses analysts’ earnings estimates for the coming year, offering a forward-looking view that can be more relevant for fast-growing companies but relies on the accuracy of those projections.
| Metric | Basis | Best Used For |
|---|---|---|
| Trailing P/E | Actual past earnings | Comparing established, stable companies |
| Forward P/E | Projected future earnings | Growth companies with rising earnings |
| Industry P/E | Sector-average valuation | Contextualizing whether a stock is cheap or expensive |
Frequently Asked Questions
Is a low P/E ratio always a good buying signal?
Not necessarily — a low P/E can indicate undervaluation, but it can also reflect genuine concerns about declining earnings, competitive threats, or industry headwinds that the market has already priced in.
Why can’t I compare P/E ratios across different industries?
Different industries have structurally different growth rates and capital intensity, so a P/E considered high in one sector (like utilities) might be considered normal or even low in another (like technology).
What does a negative P/E ratio mean?
A negative P/E occurs when a company has negative earnings (a net loss), making the ratio not meaningful — in these cases, investors often turn to alternative metrics like price-to-sales instead.
How does the P/E ratio relate to the PEG ratio?
The PEG ratio divides the P/E ratio by the company’s expected earnings growth rate, providing a way to assess whether a high P/E is justified by correspondingly high growth expectations.
Key Takeaways
The P/E ratio measures how much investors pay per dollar of a company’s earnings, and is most useful when compared within the same industry or against a company’s own historical average. It should always be considered alongside growth prospects and other valuation metrics. This article is for informational purposes only and does not constitute investment advice.

QuantPro: AI Finds the Trade Before You Do
From AI-powered chart analysis to real-time market intelligence — everything a serious investor needs, in one platform.
- Automated AI chart analysis with precision trend timing
- Bull Radar: real-time visualization of geopolitical & economic shifts
- Live market-moving news and insights, curated for you

Bull Wave / Bear Wave Forecast Model
Engineered to help you read market direction and momentum faster than the crowd.
- Instantly separate bullish momentum from bearish pressure
- Pinpoint high-probability entry zones with confidence
- Chart signals clear enough for beginners, sharp enough for pros

Winning Pattern Detection
Instantly surfaces the high-probability setups that repeat across the charts — a trusted edge for timing your entries and exits.
- Spot momentum building in real time
- Catch trend-reversal points before they break
- Built for active traders who need results, not theory

AI Live Economic Dashboard
AI analyzes real-time market data — turning complex, global investment flows into clear insight in seconds.
- Track global stock markets in real time
- See exactly which assets are strong — and which are fading
- Watch how geopolitical events move the markets
About the Author