What Is a Yield Curve Inversion
The yield curve plots the interest rates of government bonds across different maturities, from short-term (like 3-month or 2-year) to long-term (like 10-year or 30-year). Under normal conditions, the curve slopes upward — longer-maturity bonds pay higher yields to compensate investors for tying up their money for longer and taking on more uncertainty.
A yield curve inversion occurs when this relationship flips: short-term yields rise above long-term yields, meaning investors are being paid more to lend money for two years than for ten. This unusual pattern typically reflects the market pricing in expectations of slower future growth and lower interest rates down the road.
Why the Curve Inverts
Inversions commonly occur when a central bank raises short-term policy rates aggressively to combat inflation, pushing short-term yields sharply higher, while long-term yields rise more slowly or even fall because bond investors expect the central bank will eventually need to cut rates in response to slowing growth.
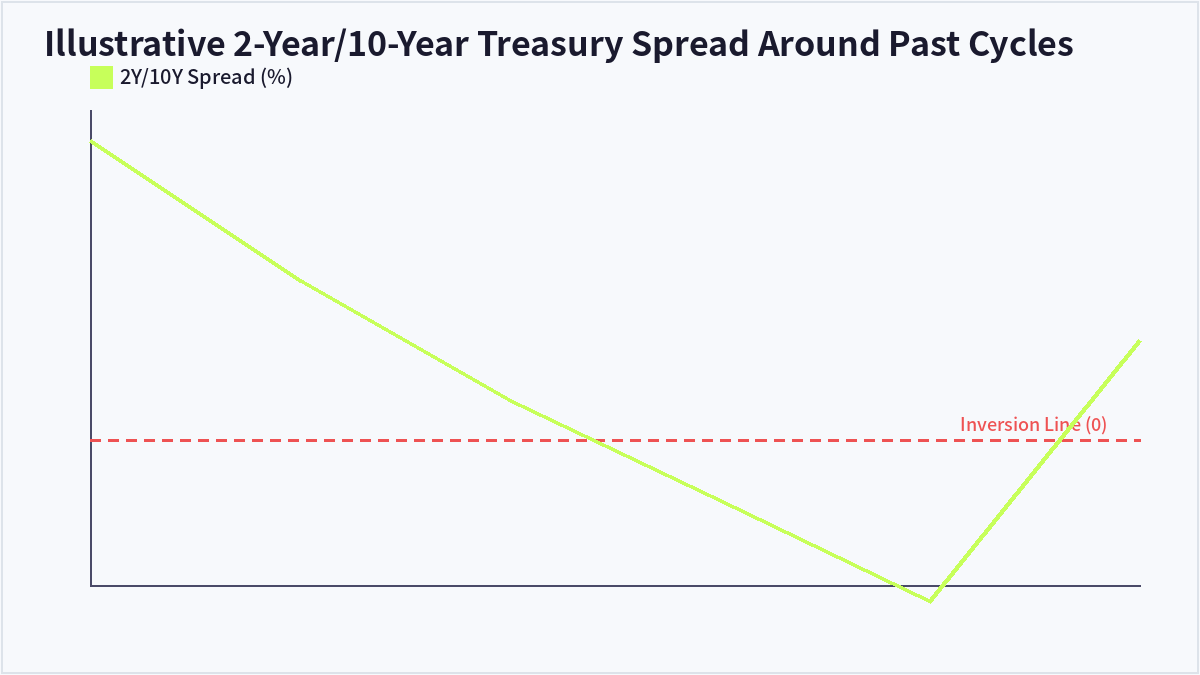
The 2-year/10-year Treasury spread is the most widely watched inversion metric in the U.S. Comparing this spread across different economic periods shows it moving from a normal positive value (like +1.5 percentage points during expansion) down toward zero and then negative (like -0.5 or -1.0 percentage points) ahead of past recessions.
How Reliable Is This Signal
The 2-year/10-year yield curve has inverted before each of the last several U.S. recessions going back decades, which is why it’s closely watched as one of the more reliable macro recession indicators available. However, the lag between inversion and the actual onset of recession has varied considerably — historically ranging from roughly 6 months to over 2 years — which limits its usefulness for precise timing.
It’s also worth noting that not every inversion has been immediately followed by a recession, and some economists argue that changes in bond market structure over time may affect how reliably this historical relationship holds going forward. As with most single indicators, it’s best interpreted alongside other economic data rather than in isolation.
| Curve State | Description | Typical Interpretation |
|---|---|---|
| Normal (upward-sloping) | Long-term yields above short-term | Healthy growth expectations |
| Flattening | Gap between short and long yields narrows | Slowing growth expectations rising |
| Inverted | Short-term yields exceed long-term | Elevated recession risk being priced in |
Frequently Asked Questions
Does an inversion mean a recession will happen immediately?
No — historically, the lag between inversion and actual recession has ranged from about 6 months to more than 2 years, so an inversion is a warning sign rather than a precise timing tool.
Which part of the yield curve matters most?
The 2-year/10-year spread is the most widely cited in the U.S., though some economists also track the 3-month/10-year spread, which has shown its own strong historical track record as a recession indicator.
Has the yield curve ever inverted without a recession following?
There have been instances where inversions weren’t immediately followed by a recession, which is part of why most economists treat it as one useful signal among several rather than a standalone predictor.
How can I track the yield curve myself?
Government sources like the U.S. Treasury and data providers such as FRED publish daily Treasury yield data across maturities, making it straightforward to track the current spread.
Key Takeaways
A yield curve inversion happens when short-term bond yields rise above long-term yields, and the 2-year/10-year spread in particular has preceded most recent U.S. recessions. While it’s one of the more historically reliable macro signals, the variable lag before a recession actually arrives means it works best alongside other economic indicators. This article is for informational purposes only and does not constitute investment advice.

QuantPro: AI Finds the Trade Before You Do
From AI-powered chart analysis to real-time market intelligence — everything a serious investor needs, in one platform.
- Automated AI chart analysis with precision trend timing
- Bull Radar: real-time visualization of geopolitical & economic shifts
- Live market-moving news and insights, curated for you

Bull Wave / Bear Wave Forecast Model
Engineered to help you read market direction and momentum faster than the crowd.
- Instantly separate bullish momentum from bearish pressure
- Pinpoint high-probability entry zones with confidence
- Chart signals clear enough for beginners, sharp enough for pros

Winning Pattern Detection
Instantly surfaces the high-probability setups that repeat across the charts — a trusted edge for timing your entries and exits.
- Spot momentum building in real time
- Catch trend-reversal points before they break
- Built for active traders who need results, not theory

AI Live Economic Dashboard
AI analyzes real-time market data — turning complex, global investment flows into clear insight in seconds.
- Track global stock markets in real time
- See exactly which assets are strong — and which are fading
- Watch how geopolitical events move the markets
About the Author