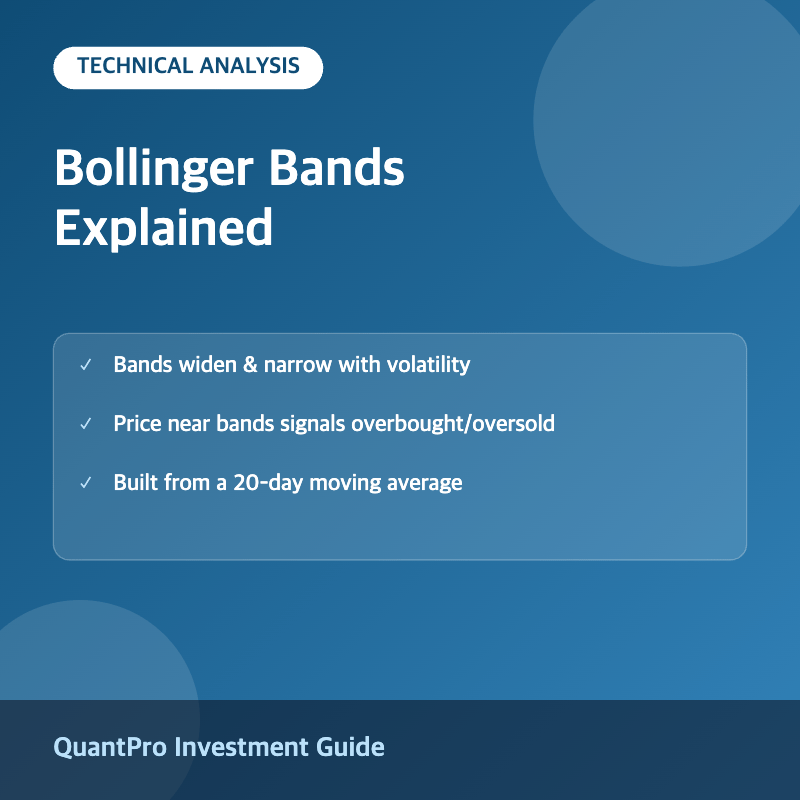
What Are Bollinger Bands?
Bollinger Bands are a technical analysis tool developed by John Bollinger that consist of three lines plotted on a price chart: a middle band, typically a 20-period simple moving average, and an upper and lower band set two standard deviations above and below the middle band.
How Bollinger Bands Are Calculated
The middle band is a simple moving average (commonly 20 periods). The upper band equals the middle band plus two standard deviations of price over the same period, while the lower band equals the middle band minus two standard deviations, causing the bands to expand and contract based on market volatility.
Interpreting Band Width
When Bollinger Bands narrow, it signals low volatility and is often referred to as a “squeeze,” which frequently precedes a significant price breakout. When bands widen, it indicates increased volatility and larger price swings.
Bollinger Bands: Signals and Strategies
| Signal | Interpretation | Common Use |
|---|---|---|
| Price touches upper band | Potentially overbought | Watch for reversal or continuation |
| Price touches lower band | Potentially oversold | Watch for reversal or continuation |
| Band squeeze (narrowing) | Low volatility, breakout likely | Anticipate a directional move |
| Band expansion | Rising volatility | Confirm trend strength |
| Price walking the band | Strong trend in progress | Trend-following confirmation |
Limitations of Bollinger Bands
Bollinger Bands are not standalone buy or sell signals; touching a band does not guarantee a reversal, especially during strong trends where price can “walk the band” for extended periods. Traders often combine Bollinger Bands with other indicators like RSI or MACD for confirmation.
Frequently Asked Questions
What does it mean when Bollinger Bands squeeze?
A Bollinger Band squeeze occurs when the bands narrow significantly, indicating low volatility. This condition often precedes a sharp price move, though the direction of the breakout is not predicted by the squeeze itself.
Should I buy when price touches the lower Bollinger Band?
Not necessarily. While touching the lower band can indicate an oversold condition, it can also occur during a strong downtrend, so traders typically wait for additional confirmation before entering a trade.
What time period is best for Bollinger Bands?
The standard setting is a 20-period moving average with 2 standard deviations, but traders can adjust these parameters depending on their trading timeframe and the asset’s typical volatility.
Can Bollinger Bands be used with other indicators?
Yes, Bollinger Bands are commonly combined with momentum indicators like RSI or MACD, as well as volume analysis, to improve the reliability of trading signals.
Key Takeaways
Bollinger Bands are a volatility-based technical indicator consisting of a moving average and two outer bands set by standard deviation, helping traders identify overbought and oversold conditions as well as periods of low or high volatility. They work best when combined with other technical indicators rather than used in isolation. This article is for informational purposes only and does not constitute investment advice.

QuantPro: AI Finds the Trade Before You Do
From AI-powered chart analysis to real-time market intelligence — everything a serious investor needs, in one platform.
- Automated AI chart analysis with precision trend timing
- Bull Radar: real-time visualization of geopolitical & economic shifts
- Live market-moving news and insights, curated for you

Bull Wave / Bear Wave Forecast Model
Engineered to help you read market direction and momentum faster than the crowd.
- Instantly separate bullish momentum from bearish pressure
- Pinpoint high-probability entry zones with confidence
- Chart signals clear enough for beginners, sharp enough for pros

Winning Pattern Detection
Instantly surfaces the high-probability setups that repeat across the charts — a trusted edge for timing your entries and exits.
- Spot momentum building in real time
- Catch trend-reversal points before they break
- Built for active traders who need results, not theory

AI Live Economic Dashboard
AI analyzes real-time market data — turning complex, global investment flows into clear insight in seconds.
- Track global stock markets in real time
- See exactly which assets are strong — and which are fading
- Watch how geopolitical events move the markets
About the Author