What Is a Moving Average?
A moving average is a technical indicator that smooths out price data by calculating the average price of a security over a specific number of periods, helping traders identify the underlying trend direction by filtering out short-term price noise.
Simple Moving Average (SMA)
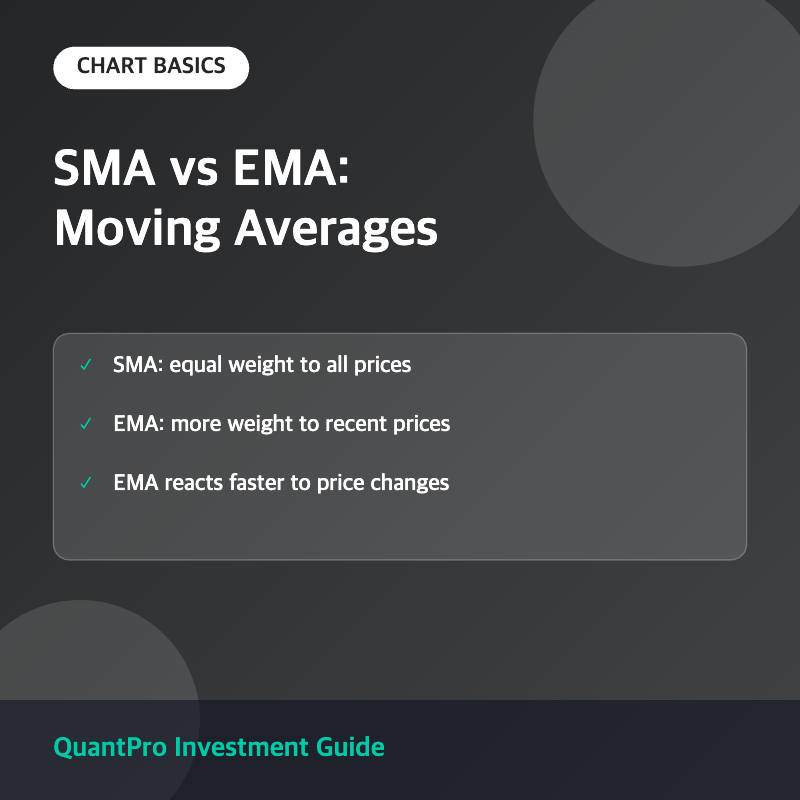
The simple moving average calculates the arithmetic mean of a security’s closing prices over a set number of periods, such as 50 or 200 days, giving equal weight to every price point in that period.
Exponential Moving Average (EMA)
The exponential moving average applies greater weight to more recent price data, making it more responsive to new information and price changes compared to the SMA, which treats all data points equally.
SMA vs. EMA: Comparison
| Feature | SMA | EMA |
|---|---|---|
| Weighting | Equal weight to all periods | More weight to recent prices |
| Responsiveness | Slower to react | Faster to react |
| Lag | Higher lag | Lower lag |
| Best Use Case | Identifying long-term trends | Catching short-term momentum shifts |
| Common Periods | 50-day, 200-day | 12-day, 26-day |
The Golden Cross and Death Cross
Moving averages are often used together to generate signals: a “golden cross” occurs when a shorter-term moving average crosses above a longer-term moving average, signaling potential bullish momentum, while a “death cross” is the opposite, signaling potential bearish momentum.
Choosing Between SMA and EMA
Traders focused on longer-term trend confirmation often prefer the SMA for its smoother, less noisy signals, while short-term traders and those seeking faster entry and exit signals often prefer the EMA for its quicker responsiveness to price action.
Frequently Asked Questions
Which moving average is more accurate, SMA or EMA?
Neither is universally more accurate; the SMA offers smoother, more stable signals with more lag, while the EMA reacts faster to price changes but can generate more false signals during choppy markets.
What is the most commonly used moving average period?
The 50-day and 200-day SMAs are widely used for identifying medium- and long-term trends, while the 12-day and 26-day EMAs are commonly used in short-term momentum indicators like MACD.
Can moving averages predict future prices?
Moving averages are lagging indicators based on past price data and do not predict future prices; they are used to confirm trends and generate signals rather than forecast exact price movements.
Do professional traders use both SMA and EMA together?
Yes, many traders combine both types, using an SMA to confirm the overall trend direction and an EMA to time entries and exits with greater sensitivity to recent price action.
Key Takeaways
The simple moving average gives equal weight to all prices in its period, producing smoother but slower signals, while the exponential moving average weights recent prices more heavily, reacting faster to changes. Both are lagging trend indicators commonly used together to confirm direction and generate crossover signals. This article is for informational purposes only and does not constitute investment advice.

QuantPro: AI Finds the Trade Before You Do
From AI-powered chart analysis to real-time market intelligence — everything a serious investor needs, in one platform.
- Automated AI chart analysis with precision trend timing
- Bull Radar: real-time visualization of geopolitical & economic shifts
- Live market-moving news and insights, curated for you

Bull Wave / Bear Wave Forecast Model
Engineered to help you read market direction and momentum faster than the crowd.
- Instantly separate bullish momentum from bearish pressure
- Pinpoint high-probability entry zones with confidence
- Chart signals clear enough for beginners, sharp enough for pros

Winning Pattern Detection
Instantly surfaces the high-probability setups that repeat across the charts — a trusted edge for timing your entries and exits.
- Spot momentum building in real time
- Catch trend-reversal points before they break
- Built for active traders who need results, not theory

AI Live Economic Dashboard
AI analyzes real-time market data — turning complex, global investment flows into clear insight in seconds.
- Track global stock markets in real time
- See exactly which assets are strong — and which are fading
- Watch how geopolitical events move the markets
About the Author