What Is Comparable Company Analysis?
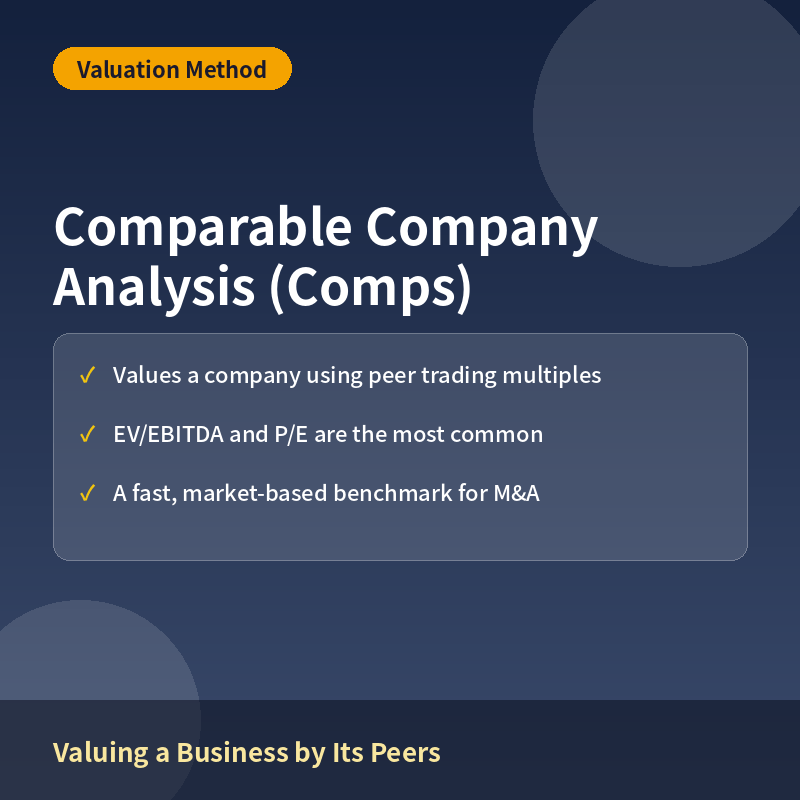
Comparable company analysis, commonly called “comps” or “trading comps,” is a relative valuation method that estimates what a business is worth by applying the valuation multiples of similar, publicly traded companies to the target company’s own financial metrics. Instead of forecasting a company’s future cash flows from scratch, comps analysis asks a simpler question: what is the market currently paying for companies like this one, and what does that imply for the company being valued? It is one of the most widely used valuation methods in equity research, investment banking, and private equity because it is fast to build and grounded directly in observable market prices.
How Comps Analysis Works
Step 1: Select a Peer Group
The analysis starts by identifying a group of publicly traded companies that are genuinely comparable to the target — typically similar in industry, business model, size, growth rate, profit margins, and geographic footprint. The quality of a comps analysis depends heavily on how well-chosen this peer group is; a peer group of companies that only superficially resemble the target can produce a badly misleading valuation.
Step 2: Gather and Normalize Financial Data
Next, analysts collect financial data for each peer — revenue, EBITDA (earnings before interest, taxes, depreciation, and amortization), net income, and market capitalization — and adjust it for one-time items, unusual accounting treatments, or non-operating gains and losses, so the figures reflect ongoing, comparable operating performance across companies.
Step 3: Calculate Trading Multiples
Analysts then compute standardized valuation multiples for each peer, most commonly enterprise value divided by EBITDA (EV/EBITDA), where enterprise value equals market capitalization plus total debt minus cash. Other common multiples include EV/Revenue and the price-to-earnings ratio (P/E). These multiples let analysts compare companies of very different sizes on an apples-to-apples basis.
Step 4: Apply the Multiple to the Target
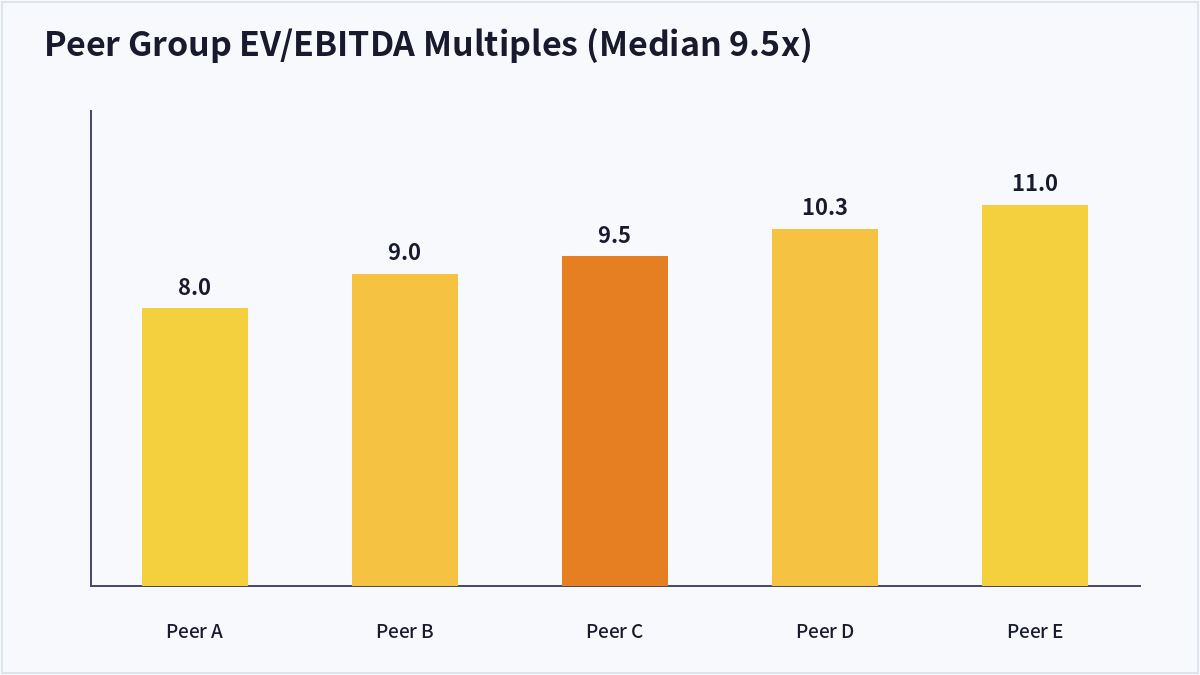
Finally, analysts apply the peer group’s median (or mean) multiple to the target company’s own financial metric to estimate its implied value. For example, suppose a target company has $50 million of EBITDA, and its peer group’s EV/EBITDA multiples are 8.0x, 9.0x, 9.5x, 10.3x, and 11.0x, giving a median multiple of 9.5x. Applying that median multiple: implied enterprise value = $50 million x 9.5 = $475 million. Using the low end of the peer range (8.0x) implies $400 million, while the high end (11.0x) implies $550 million, giving a valuation range rather than a single point estimate.
Comps vs. Other Valuation Methods
| Method | Basis | Typical Use | Key Limitation |
|---|---|---|---|
| Comparable Company Analysis | Public peer trading multiples | Quick, market-based benchmark | Assumes chosen peers are truly comparable |
| Discounted Cash Flow (DCF) | Intrinsic projected cash flows | Standalone value independent of market sentiment | Highly sensitive to growth and discount-rate assumptions |
| Precedent Transactions | Multiples paid in past M&A deals | Includes a control premium for M&A context | Deal data can be stale or limited in number |
Common Multiples Used in Comps
EV/EBITDA is popular because it is capital-structure neutral — since enterprise value already includes debt, the multiple isn’t distorted by how much debt or cash a company holds, making it useful for comparing companies with different leverage. P/E (price divided by earnings per share) is an equity-level multiple, useful and intuitive, but more sensitive to differences in leverage, tax rates, and one-time accounting items across peers. EV/Revenue is often used for early-stage or low-margin businesses where EBITDA is small, negative, or not yet meaningful. A PEG ratio (P/E divided by expected earnings growth) is sometimes used to adjust a P/E-style multiple for differences in growth rates between peers.
Limitations of Comparable Company Analysis
No two companies are perfectly identical, so any peer group involves some degree of compromise, and a poorly chosen peer set can quietly bias the whole valuation. Comps also assume that the market has priced the peer group correctly; if the entire sector is temporarily overvalued or undervalued, that mispricing gets built directly into the target’s implied valuation. The method captures general market sentiment about a sector well, but it can understate or overstate value for companies with genuine competitive advantages, disadvantages, or growth profiles that differ meaningfully from the peer average. For these reasons, comps are typically used alongside, not instead of, other valuation methods like a DCF.
Frequently Asked Questions
What’s the difference between EV/EBITDA and P/E in comps?
EV/EBITDA is based on enterprise value, which reflects the whole company’s operations regardless of how it is financed, making it neutral to differences in debt levels between peers. P/E is based on equity value and net income, both of which are affected by a company’s capital structure, tax rate, and non-operating items, so P/E comparisons can be distorted when peers have meaningfully different leverage.
How many peer companies should a comps analysis include?
There is no fixed rule, but analysts typically look for somewhere around five to fifteen genuinely comparable companies. Too few peers make the resulting median or average multiple unstable and easily skewed by a single outlier; too many peers risk diluting comparability by including businesses that aren’t truly similar to the target.
Is comps analysis more reliable than a DCF?
Neither method is inherently more reliable; they answer slightly different questions and have different weaknesses. Comps reflect current market sentiment and are quick to build but can inherit sector-wide mispricing. A DCF is grounded in a company’s own projected cash flows but is highly sensitive to assumptions about growth and the discount rate. Analysts commonly use both together and treat any large gap between the two as worth investigating.
What’s the difference between “trading comps” and “transaction comps”?
Trading comps (comparable company analysis) uses the current stock market valuations of publicly traded peer companies. Transaction comps (precedent transactions analysis) instead uses the multiples actually paid in past M&A deals for similar companies, which typically include a control premium since an acquirer is paying for outright ownership, not just a minority stake.
Key Takeaways
Comparable company analysis values a business by benchmarking it against similar publicly traded peers, most commonly using the EV/EBITDA multiple, to produce a market-grounded valuation range rather than a single precise number. Its speed and market grounding make it a standard first step in equity research and M&A work, but its accuracy depends entirely on choosing a truly comparable peer group and recognizing that it inherits whatever mispricing exists in that peer group. This article is for informational purposes only and does not constitute investment advice.

QuantPro: AI Finds the Trade Before You Do
From AI-powered chart analysis to real-time market intelligence — everything a serious investor needs, in one platform.
- Automated AI chart analysis with precision trend timing
- Bull Radar: real-time visualization of geopolitical & economic shifts
- Live market-moving news and insights, curated for you

Bull Wave / Bear Wave Forecast Model
Engineered to help you read market direction and momentum faster than the crowd.
- Instantly separate bullish momentum from bearish pressure
- Pinpoint high-probability entry zones with confidence
- Chart signals clear enough for beginners, sharp enough for pros

Winning Pattern Detection
Instantly surfaces the high-probability setups that repeat across the charts — a trusted edge for timing your entries and exits.
- Spot momentum building in real time
- Catch trend-reversal points before they break
- Built for active traders who need results, not theory

AI Live Economic Dashboard
AI analyzes real-time market data — turning complex, global investment flows into clear insight in seconds.
- Track global stock markets in real time
- See exactly which assets are strong — and which are fading
- Watch how geopolitical events move the markets
About the Author