Two Different Lenses on Profitability
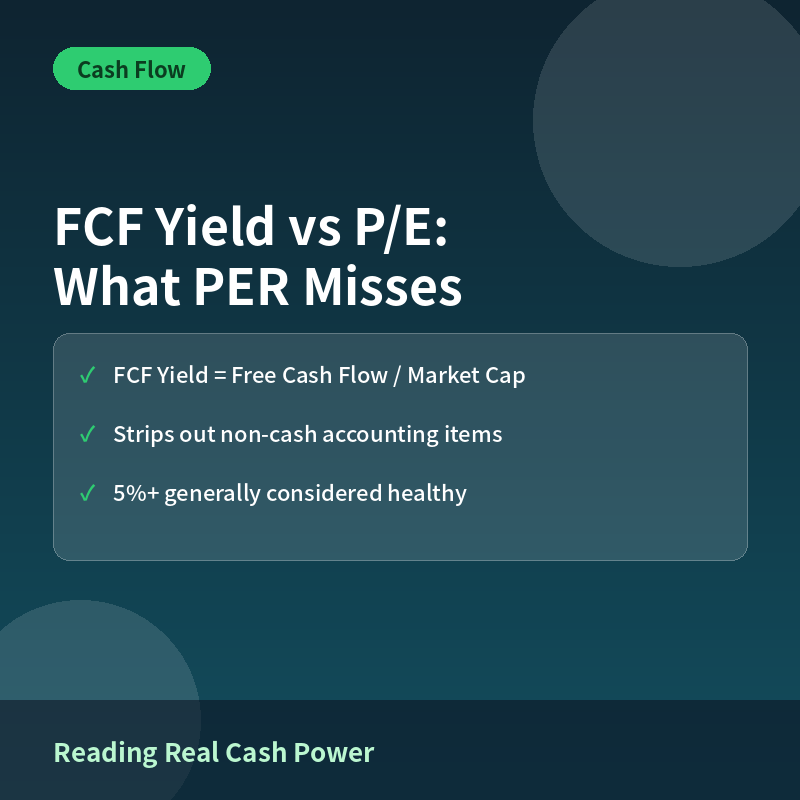
The P/E ratio divides market capitalization by net income, an accounting figure shaped by depreciation, provisions, and non-cash adjustments. FCF Yield instead divides free cash flow, operating cash flow minus capital expenditures, by market capitalization, measuring the cash actually left over for shareholders.
Where Net Income and Cash Flow Diverge
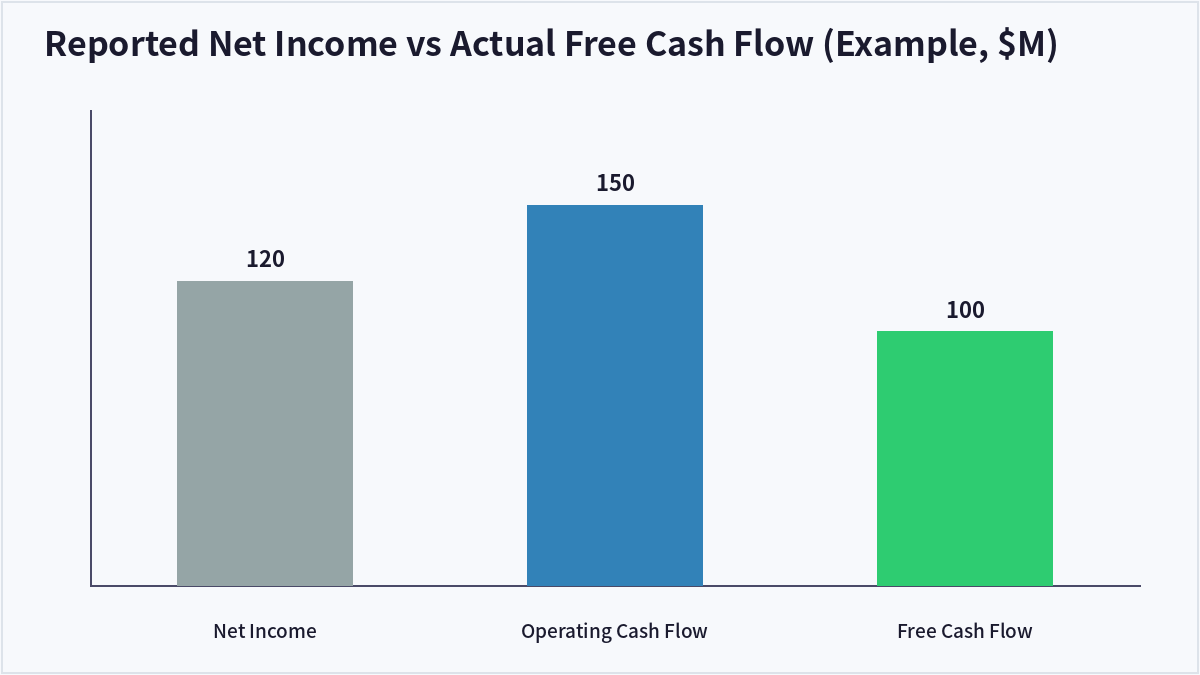
A company can report solid net income while its receivables balloon, meaning revenue is booked but cash has not yet arrived. In such cases operating cash flow can lag reported earnings significantly, a gap that P/E alone cannot reveal but FCF Yield captures directly.
Worked Example
A company with $150 million in operating cash flow and $50 million in capital expenditures generates $100 million in free cash flow. At a $1.5 billion market cap, its FCF Yield is 6.7%, generally read as healthy cash generation, a picture the P/E ratio alone would not show if net income were distorted by one-off items.
When P/E Looks Fine but FCF Yield Does Not
A capital-intensive company can show an attractive, low P/E while sinking most of its cash into equipment upgrades, leaving little free cash flow for dividends or buybacks. Relying on P/E alone in this case risks overlooking a structural cash-flow constraint.
| FCF Yield Range | Interpretation |
|---|---|
| 8%+ | Excellent cash generation |
| 5-8% | Healthy |
| 2-5% | Average, compare to sector |
| Below 2% or negative | Cash flow risk warrants a closer look |
Frequently Asked Questions
Is FCF Yield the same as dividend yield?
No. FCF Yield measures the cash a company generates regardless of whether it is paid out, while dividend yield only reflects the portion actually distributed to shareholders.
Are capital-intensive sectors always disadvantaged?
Sectors like semiconductors and shipbuilding structurally require heavy capex, so comparing FCF Yield within the same sector, or across a full investment cycle, gives a fairer picture than comparing across unrelated industries.
Is a high FCF Yield always a good sign?
Not necessarily; a temporary cut in capital spending can inflate FCF Yield for a period, so checking the multi-quarter trend and future capex plans is important before relying on a single reading.
Where can investors find FCF figures?
FCF can be calculated directly from the cash flow statement by subtracting capital expenditures from operating cash flow, or investors can reference figures published in brokerage research reports.
Key Takeaways
FCF Yield reveals the cash a business actually generates rather than the accounting profit it reports, filling a gap that P/E alone cannot address. Comparing the two together, alongside sector-specific capex needs, gives a more complete read on cash-generating power. This article is for informational purposes only and does not constitute investment advice.

QuantPro: AI Finds the Trade Before You Do
From AI-powered chart analysis to real-time market intelligence — everything a serious investor needs, in one platform.
- Automated AI chart analysis with precision trend timing
- Bull Radar: real-time visualization of geopolitical & economic shifts
- Live market-moving news and insights, curated for you

Bull Wave / Bear Wave Forecast Model
Engineered to help you read market direction and momentum faster than the crowd.
- Instantly separate bullish momentum from bearish pressure
- Pinpoint high-probability entry zones with confidence
- Chart signals clear enough for beginners, sharp enough for pros

Winning Pattern Detection
Instantly surfaces the high-probability setups that repeat across the charts — a trusted edge for timing your entries and exits.
- Spot momentum building in real time
- Catch trend-reversal points before they break
- Built for active traders who need results, not theory

AI Live Economic Dashboard
AI analyzes real-time market data — turning complex, global investment flows into clear insight in seconds.
- Track global stock markets in real time
- See exactly which assets are strong — and which are fading
- Watch how geopolitical events move the markets
About the Author