How the Two Formulas Differ
Return on Equity (ROE) divides net income by shareholders’ equity, reflecting profitability purely from the shareholder’s perspective. Return on Invested Capital (ROIC) divides after-tax operating profit (NOPAT) by invested capital, which includes both equity and net debt, capturing the efficiency of every dollar put to work in the business regardless of how it was financed.
How Debt Can Inflate ROE
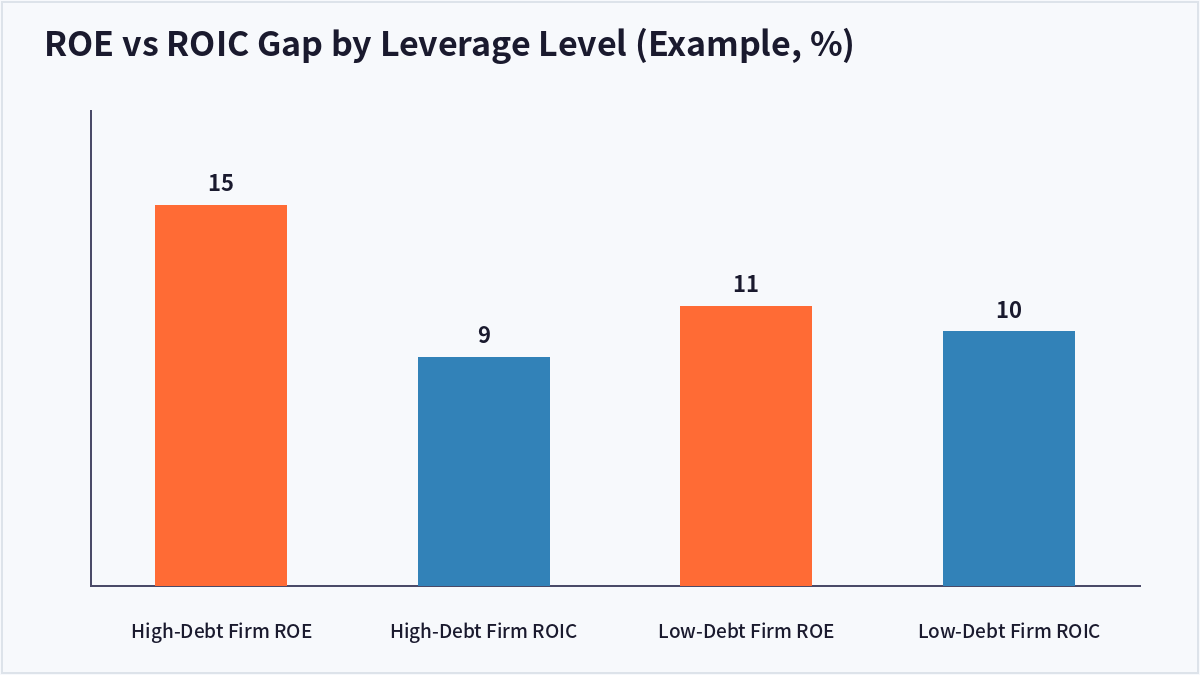
A company with modest equity but heavy debt can post a high ROE purely through leverage. For example, $100 million in equity generating $15 million in net income yields a 15% ROE, but if much of that profit stems from cheap borrowed capital, the underlying business efficiency measured by ROIC might be closer to 8-9%.
Why ROIC Is the More Honest Metric
Because ROIC is indifferent to financing structure, it allows a fairer comparison between companies with very different debt levels. When comparing firms across a sector with varying leverage, ROIC strips out the distortion that debt introduces into ROE.
Using Both Metrics Together
When ROE is significantly higher than ROIC, that gap approximates the leverage effect at work, a useful flag in rising-rate environments where higher interest expense can quickly compress ROE even if the underlying business hasn’t changed.
| Metric | ROE | ROIC |
|---|---|---|
| Denominator | Shareholders’ equity | Invested capital (equity + net debt) |
| Leverage sensitivity | High | Relatively low |
| Best use | Shareholder-perspective profitability | Underlying business capital efficiency |
Frequently Asked Questions
Why does ROIC need to exceed WACC?
If ROIC falls below the weighted average cost of capital (WACC), the company isn’t even covering its cost of capital with the returns generated, so checking whether ROIC minus WACC (economic value added) is positive matters more than the raw ROIC figure alone.
Do debt-free companies show similar ROE and ROIC?
Companies with minimal net debt tend to see the two metrics converge, making ROE alone a reasonably reliable profitability gauge in those specific cases.
Where can I find ROIC figures?
ROIC can be calculated by applying (1 – tax rate) to operating income to get NOPAT, then dividing by the sum of equity and net debt; some brokerage research platforms also publish it directly.
Does ROIC apply well to financial companies?
Not cleanly. For banks and insurers, where debt-like liabilities (deposits, etc.) are core to the business model itself, ROIC calculations get distorted, so ROE or sector-specific metrics are typically used instead.
Key Takeaways
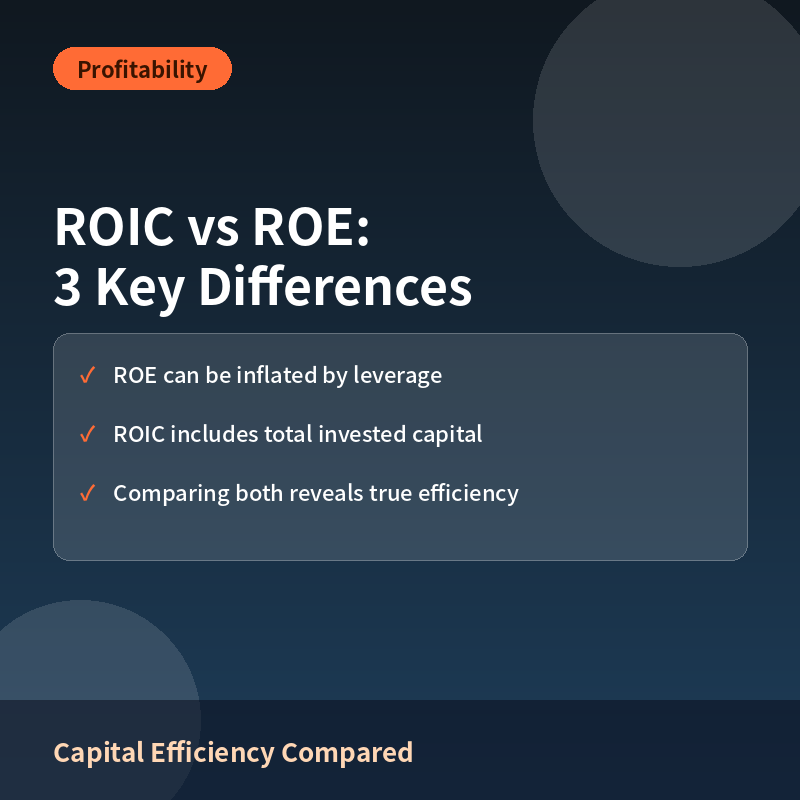
ROE can be inflated by financial leverage, while ROIC measures how efficiently all invested capital is used regardless of financing structure. Comparing the two side by side helps distinguish profitability driven by genuine business strength from profitability driven mainly by debt. This article is for informational purposes only and does not constitute investment advice.

QuantPro: AI Finds the Trade Before You Do
From AI-powered chart analysis to real-time market intelligence — everything a serious investor needs, in one platform.
- Automated AI chart analysis with precision trend timing
- Bull Radar: real-time visualization of geopolitical & economic shifts
- Live market-moving news and insights, curated for you

Bull Wave / Bear Wave Forecast Model
Engineered to help you read market direction and momentum faster than the crowd.
- Instantly separate bullish momentum from bearish pressure
- Pinpoint high-probability entry zones with confidence
- Chart signals clear enough for beginners, sharp enough for pros

Winning Pattern Detection
Instantly surfaces the high-probability setups that repeat across the charts — a trusted edge for timing your entries and exits.
- Spot momentum building in real time
- Catch trend-reversal points before they break
- Built for active traders who need results, not theory

AI Live Economic Dashboard
AI analyzes real-time market data — turning complex, global investment flows into clear insight in seconds.
- Track global stock markets in real time
- See exactly which assets are strong — and which are fading
- Watch how geopolitical events move the markets
About the Author