What Is the PEG Ratio?
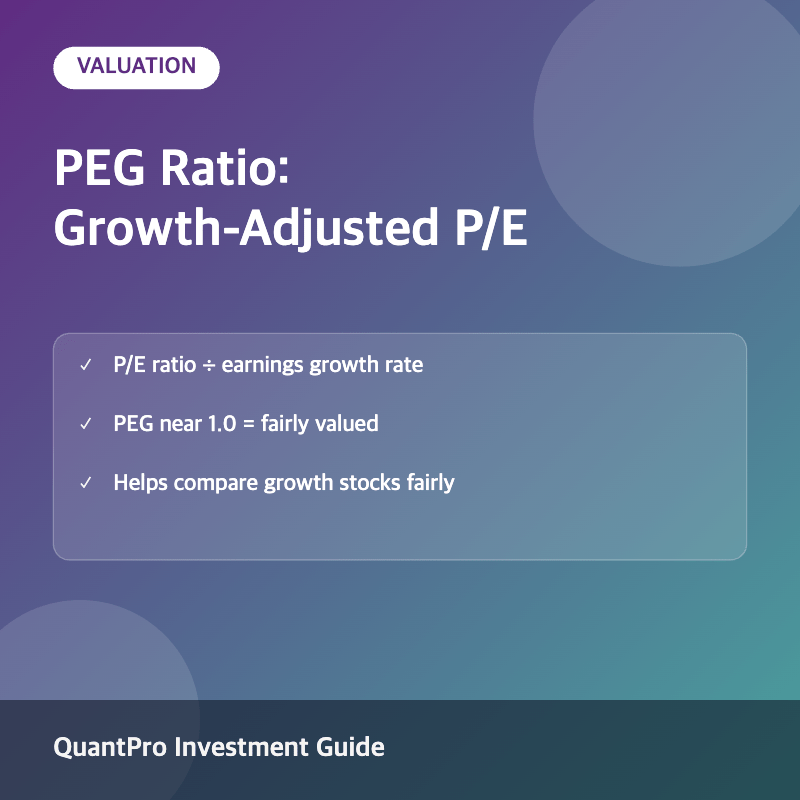
The price/earnings-to-growth (PEG) ratio is a valuation metric that divides a stock’s P/E ratio by its expected earnings growth rate, providing a more complete picture of valuation by factoring in how fast a company is growing, not just its current price relative to earnings.
How to Calculate the PEG Ratio
The PEG ratio is calculated as P/E ratio divided by the annual earnings growth rate (expressed as a whole number, not a decimal). For example, a stock with a P/E of 20 and expected earnings growth of 20% would have a PEG ratio of 1.0.
Why the PEG Ratio Matters
Two stocks can share an identical P/E ratio yet have very different growth prospects. The PEG ratio normalizes for this difference, helping investors avoid dismissing a high-P/E stock as overvalued when its growth rate justifies the premium, or mistaking a low-P/E stock for a bargain when its growth is stagnant.
Illustrating the PEG Ratio: Same P/E, Different Growth
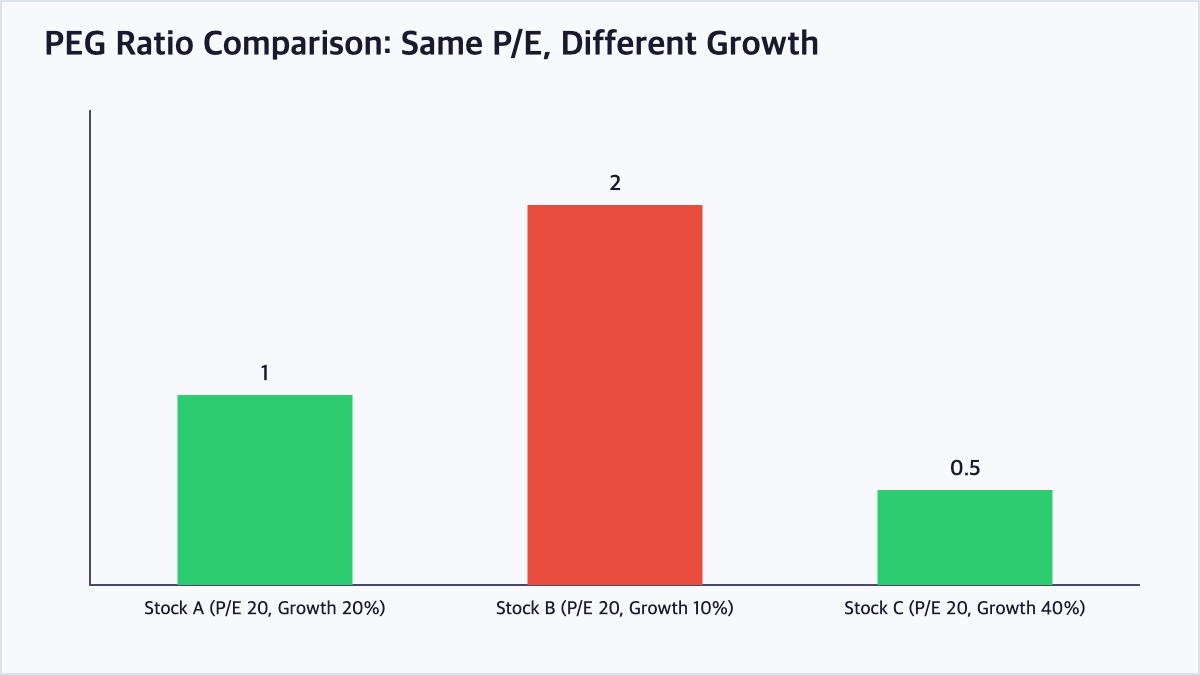
As shown above, Stock B looks expensive on a PEG basis despite sharing the same P/E as Stock A, because its growth rate is much lower. Stock C, growing fastest, has the lowest PEG ratio and may be the most attractively valued of the three on a growth-adjusted basis.
PEG Ratio Interpretation Guide
| PEG Ratio | General Interpretation |
|---|---|
| Below 1.0 | Potentially undervalued relative to growth |
| Around 1.0 | Fairly valued (price matches growth) |
| Above 1.0 | Potentially overvalued relative to growth |
| Above 2.0 | Significant growth premium priced in |
| Negative | Not meaningful (negative earnings or growth) |
Limitations of the PEG Ratio
The PEG ratio depends heavily on growth estimates, which are projections and can prove inaccurate. It also does not account for differences in risk, debt levels, or the sustainability of growth rates across industries, so it works best as one tool among several.
Frequently Asked Questions
What is considered a good PEG ratio?
A PEG ratio around 1.0 is often considered fairly valued, with values below 1.0 potentially indicating undervaluation relative to growth, though acceptable ranges can vary by sector and market conditions.
Is a lower PEG ratio always better?
Not necessarily. A very low PEG ratio could reflect unrealistic growth assumptions or hidden business risks, so it should be checked against the company’s fundamentals rather than relied upon in isolation.
What growth rate should I use to calculate PEG?
Analysts commonly use either the trailing 3-5 year historical growth rate or forward-looking analyst growth estimates, and results can differ meaningfully depending on which is used.
How is PEG different from the P/E ratio?
The P/E ratio only measures price relative to current earnings, while the PEG ratio adjusts for expected growth, making it more useful for comparing companies with different growth trajectories.
Key Takeaways
The PEG ratio refines the traditional P/E ratio by incorporating expected earnings growth, offering a more balanced view of valuation for growth-oriented companies. A PEG near 1.0 is often viewed as fair value, but the metric depends on growth estimates and works best alongside other fundamental analysis tools. This article is for informational purposes only and does not constitute investment advice.

QuantPro: AI Finds the Trade Before You Do
From AI-powered chart analysis to real-time market intelligence — everything a serious investor needs, in one platform.
- Automated AI chart analysis with precision trend timing
- Bull Radar: real-time visualization of geopolitical & economic shifts
- Live market-moving news and insights, curated for you

Bull Wave / Bear Wave Forecast Model
Engineered to help you read market direction and momentum faster than the crowd.
- Instantly separate bullish momentum from bearish pressure
- Pinpoint high-probability entry zones with confidence
- Chart signals clear enough for beginners, sharp enough for pros

Winning Pattern Detection
Instantly surfaces the high-probability setups that repeat across the charts — a trusted edge for timing your entries and exits.
- Spot momentum building in real time
- Catch trend-reversal points before they break
- Built for active traders who need results, not theory

AI Live Economic Dashboard
AI analyzes real-time market data — turning complex, global investment flows into clear insight in seconds.
- Track global stock markets in real time
- See exactly which assets are strong — and which are fading
- Watch how geopolitical events move the markets
About the Author