What Divergence Means
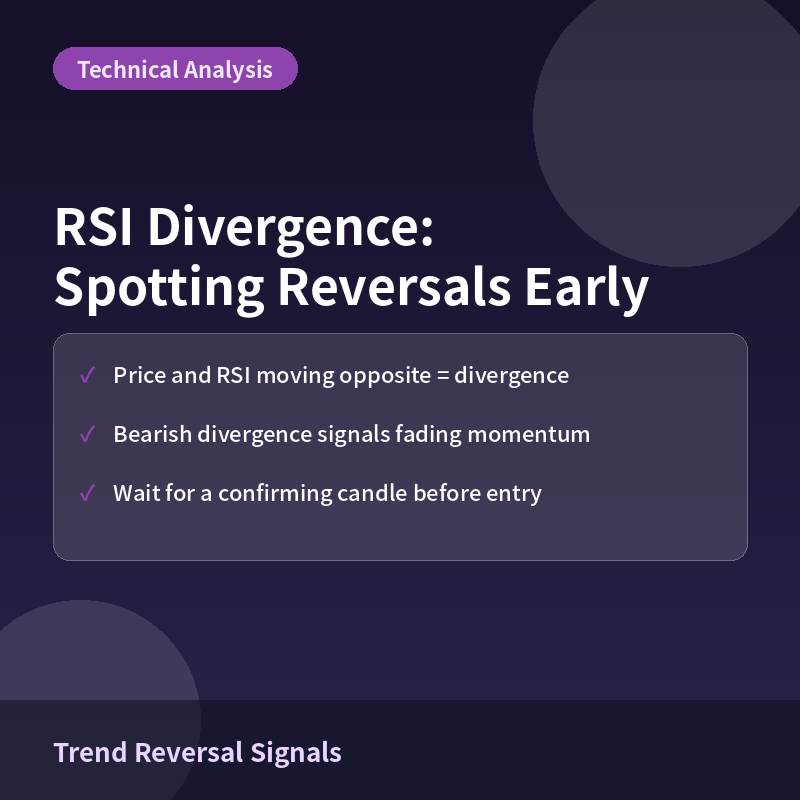
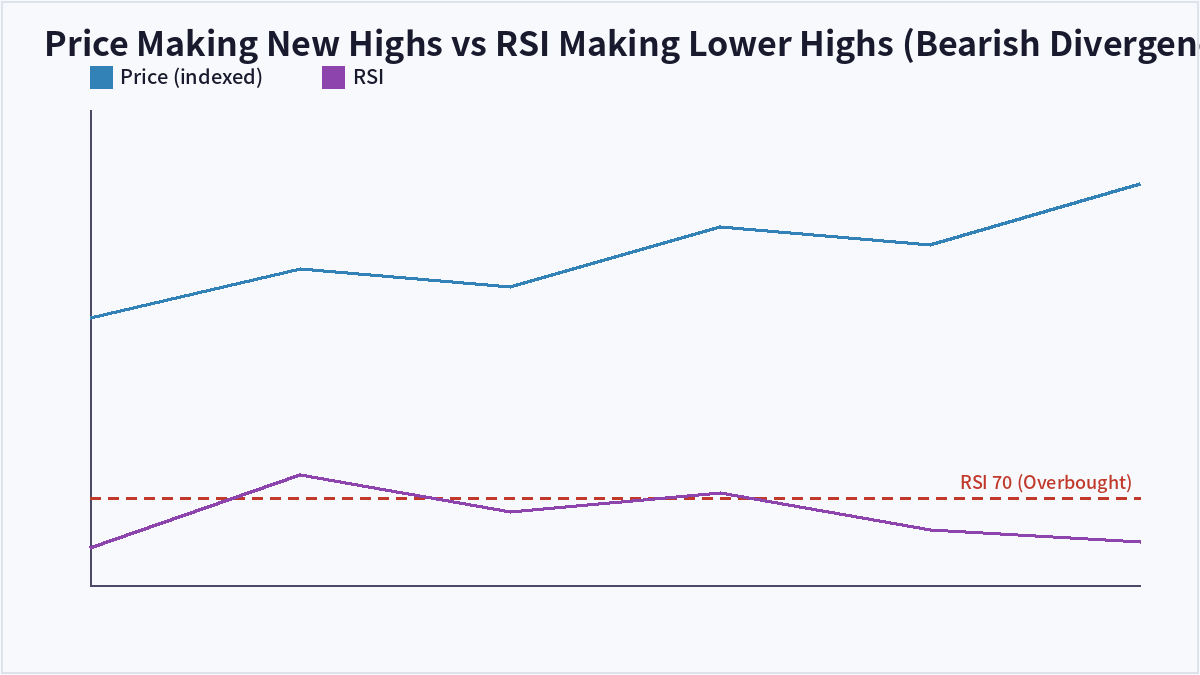
Divergence occurs when price and the Relative Strength Index (RSI) move in opposite directions. When price sets a new high but RSI forms a lower high, that’s bearish divergence, warning that upward momentum is fading. When price sets a new low but RSI forms a higher low, that’s bullish divergence, suggesting downward pressure is easing.
Confirming the Signal Before Acting
Spotting divergence alone is not enough to enter a trade. Traders typically wait for RSI to exit the overbought (70) or oversold (30) zone and for a confirming candle that breaks the prior swing high or low before acting on the signal.
Bearish vs Bullish Divergence
Bearish divergence tends to appear near the end of uptrends, and bullish divergence near the end of downtrends. In strong trending markets, however, divergence can appear repeatedly without a reversal actually occurring, known as failed divergence, so confirming with volume or trendlines improves reliability.
Hidden Divergence
Hidden divergence is the mirror image: price sets a higher low while RSI sets a lower low. Rather than signaling reversal, hidden bullish divergence is typically read as confirmation that the existing uptrend is likely to continue, an important distinction from ordinary reversal divergence.
| Type | Price Action | RSI Action | Interpretation |
|---|---|---|---|
| Bearish Divergence | New high | Lower high | Fading upward momentum |
| Bullish Divergence | New low | Higher low | Fading downward momentum |
| Hidden Bullish Divergence | Higher low | Lower low | Uptrend likely to continue |
Frequently Asked Questions
Can I trade on divergence alone?
Divergence is a leading signal, not a confirmed one, so pairing it with trendline breaks or volume changes is safer than acting on divergence in isolation.
What RSI period should I use?
The standard default is 14 periods; shorter periods like 9 are sometimes used for short-term trading, while longer periods like 21 suit medium- to long-term trend analysis.
Does divergence work better on certain timeframes?
Divergence tends to be more reliable on daily or weekly charts, while very short timeframes like 1-minute charts carry more noise that can weaken signal reliability.
Can divergence appear during strong trends without a reversal?
Yes, in strong trends divergence can appear multiple times without the trend actually breaking, so the possibility of failed divergence should always be kept in mind.
Key Takeaways
RSI divergence highlights a gap between price action and underlying momentum that can flag a possible trend reversal, but it works best as a leading signal confirmed with candle patterns and volume rather than a standalone trading trigger. This article is for informational purposes only and does not constitute investment advice.

QuantPro: AI Finds the Trade Before You Do
From AI-powered chart analysis to real-time market intelligence — everything a serious investor needs, in one platform.
- Automated AI chart analysis with precision trend timing
- Bull Radar: real-time visualization of geopolitical & economic shifts
- Live market-moving news and insights, curated for you

Bull Wave / Bear Wave Forecast Model
Engineered to help you read market direction and momentum faster than the crowd.
- Instantly separate bullish momentum from bearish pressure
- Pinpoint high-probability entry zones with confidence
- Chart signals clear enough for beginners, sharp enough for pros

Winning Pattern Detection
Instantly surfaces the high-probability setups that repeat across the charts — a trusted edge for timing your entries and exits.
- Spot momentum building in real time
- Catch trend-reversal points before they break
- Built for active traders who need results, not theory

AI Live Economic Dashboard
AI analyzes real-time market data — turning complex, global investment flows into clear insight in seconds.
- Track global stock markets in real time
- See exactly which assets are strong — and which are fading
- Watch how geopolitical events move the markets
About the Author