How the Sortino Ratio Is Calculated
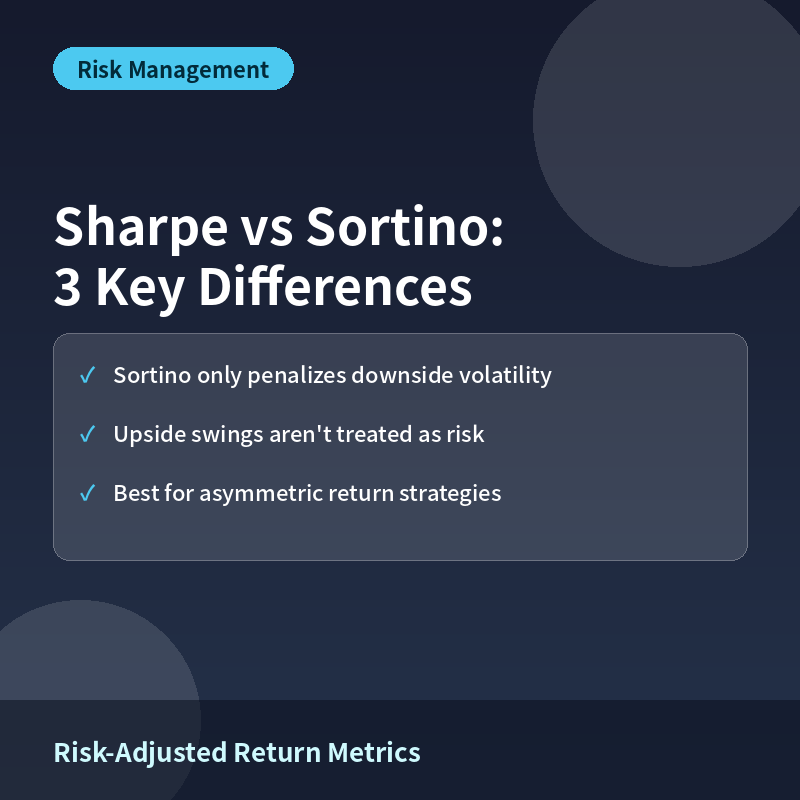
The Sortino ratio shares a similar structure to the Sharpe ratio but replaces the denominator, total standard deviation, with downside deviation, the volatility measured only from returns that fall below a target (often zero). Large upside moves are not counted as risk at all.
What the Sharpe Ratio Misses: Penalizing Upside
Because the Sharpe ratio treats all volatility, up or down, as equally risky, a strategy prone to occasional sharp rallies can see its standard deviation, and therefore its Sharpe ratio, unfairly penalized. Critics have long argued that punishing upside surprises as ‘risk’ runs counter to investor intuition, which is exactly what the Sortino ratio was designed to address.
When the Two Metrics Diverge Sharply
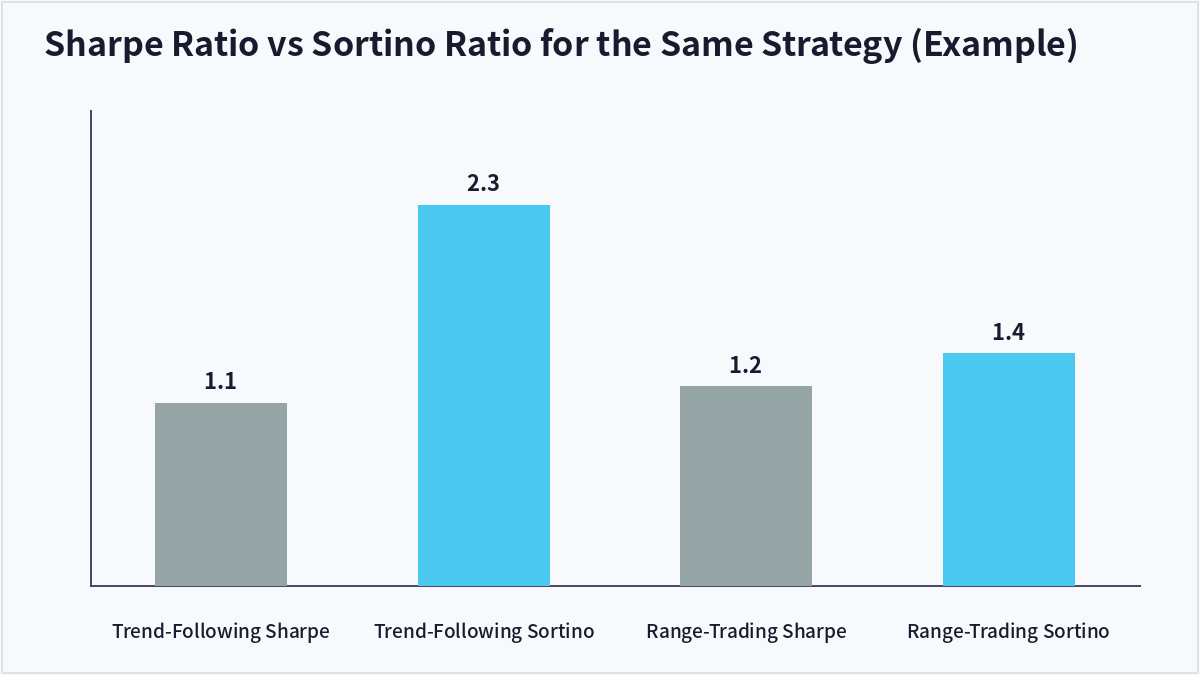
Strategies that let winners run while cutting losses short, such as trend-following approaches, tend to show a much higher Sortino ratio than Sharpe ratio. Strategies with roughly symmetric up and down swings show far less divergence between the two.
Which Metric Should You Prioritize
For investors who prioritize avoiding losses, the Sortino ratio may better reflect the risk they actually feel. Comparing both together, and noting how far apart they are, can reveal whether a strategy has an asymmetric return profile worth understanding before committing capital.
| Metric | Sharpe Ratio | Sortino Ratio |
|---|---|---|
| Denominator | Total volatility (std dev) | Downside deviation only |
| Treats upside swings as | Risk (penalized) | Not risk |
| Best fit | Symmetric return strategies | Asymmetric (skewed-upside) strategies |
Frequently Asked Questions
Is the Sortino ratio always higher than the Sharpe ratio?
Generally yes, since it only counts downside volatility, but it’s not guaranteed in every case, the outcome depends on the actual shape of the return distribution.
How is the target return (MAR) set?
Some analysts use 0% as the threshold for any loss, others use the risk-free rate or a custom minimum acceptable return, and the choice of threshold changes the resulting ratio.
Why look at both metrics together?
The Sharpe ratio gives a picture of overall stability, while the Sortino ratio focuses specifically on downside risk, so viewing both together reveals whether a strategy’s return profile is asymmetric.
Can individual investors calculate this themselves?
Yes, with monthly return data in a spreadsheet, downside deviation can be calculated by isolating only the negative-return months and computing their standard deviation.
Key Takeaways
The Sortino ratio refines the Sharpe ratio by only penalizing downside volatility, leaving upside swings untouched, which makes it a useful complement for evaluating strategies with asymmetric return profiles. Comparing the two together reveals more about a strategy’s true risk character than either alone. This article is for informational purposes only and does not constitute investment advice.

QuantPro: AI Finds the Trade Before You Do
From AI-powered chart analysis to real-time market intelligence — everything a serious investor needs, in one platform.
- Automated AI chart analysis with precision trend timing
- Bull Radar: real-time visualization of geopolitical & economic shifts
- Live market-moving news and insights, curated for you

Bull Wave / Bear Wave Forecast Model
Engineered to help you read market direction and momentum faster than the crowd.
- Instantly separate bullish momentum from bearish pressure
- Pinpoint high-probability entry zones with confidence
- Chart signals clear enough for beginners, sharp enough for pros

Winning Pattern Detection
Instantly surfaces the high-probability setups that repeat across the charts — a trusted edge for timing your entries and exits.
- Spot momentum building in real time
- Catch trend-reversal points before they break
- Built for active traders who need results, not theory

AI Live Economic Dashboard
AI analyzes real-time market data — turning complex, global investment flows into clear insight in seconds.
- Track global stock markets in real time
- See exactly which assets are strong — and which are fading
- Watch how geopolitical events move the markets
About the Author