What Is Volatility Skew?
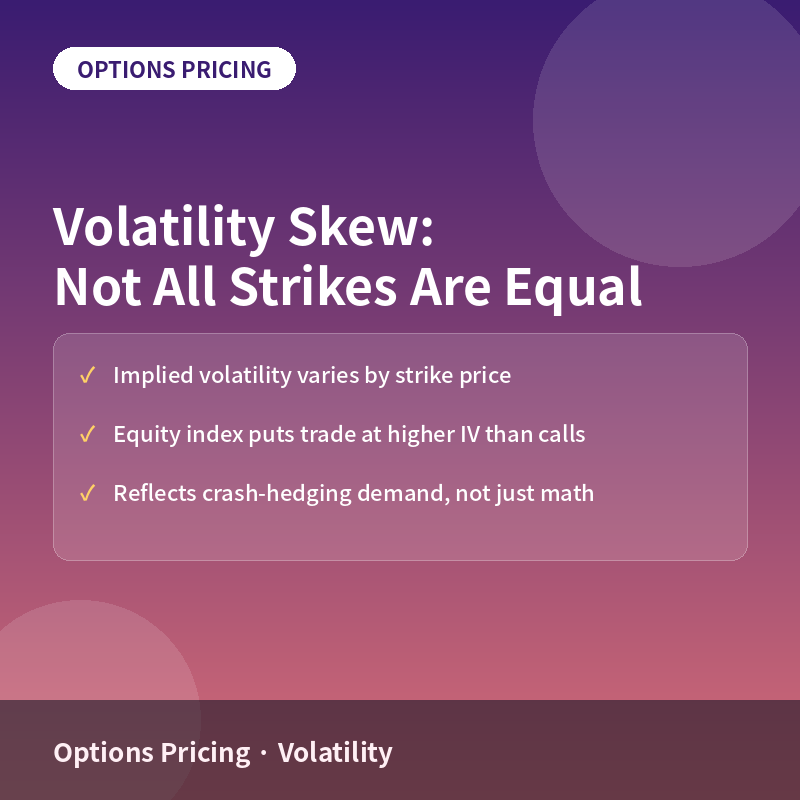
Volatility skew refers to the pattern in which options on the same underlying asset, with the same expiration date, trade at different implied volatilities depending on their strike price. In a simplified Black-Scholes world, implied volatility would be flat across all strikes — one number describing expected future volatility, regardless of which strike an option uses. In real markets, it is rarely flat.
The Equity Index ‘Smirk’
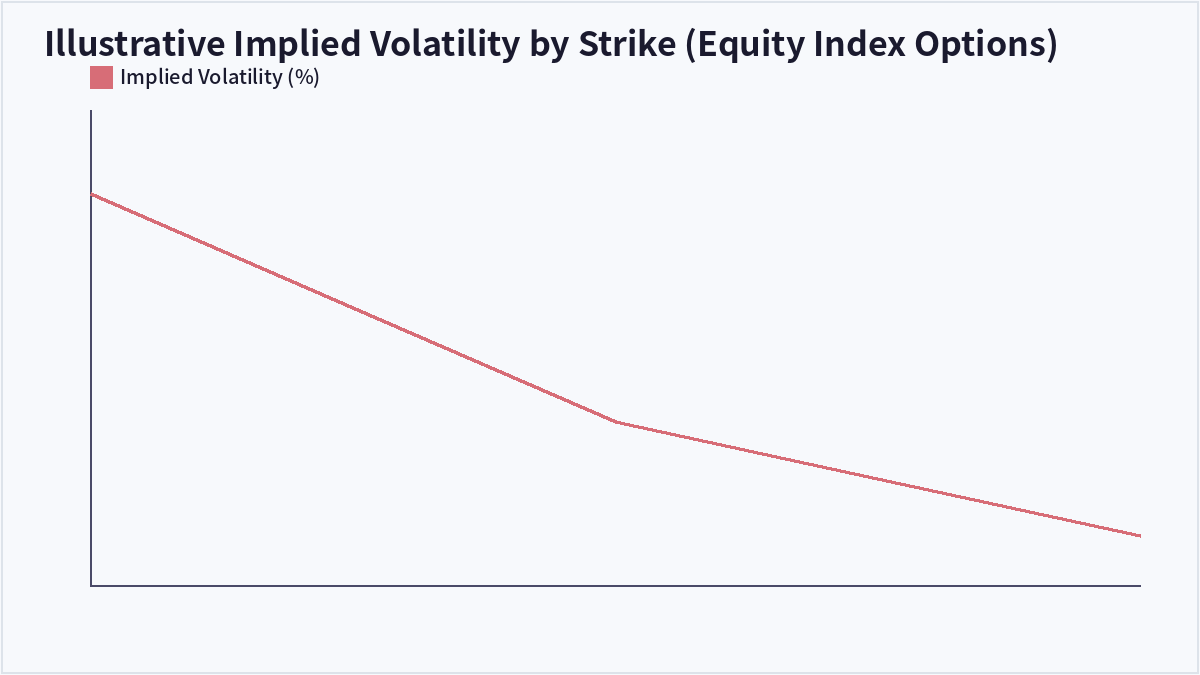
For equity index options like those on the S&P 500, the typical pattern is a downward-sloping skew often called a ‘volatility smirk’: out-of-the-money put options (struck below the current price) trade at meaningfully higher implied volatility than at-the-money options, while out-of-the-money call options trade at somewhat lower implied volatility. A realistic illustration: with the index at 100%, a put struck at 90% might show 22% implied volatility, the at-the-money option might show 16%, and a call struck at 110% might show 13%.
Why the Skew Exists
This shape is largely attributed to persistent demand for downside protection. Institutional investors regularly buy out-of-the-money puts to hedge portfolios against sharp declines, and that steady buying pressure bids up the implied volatility of those puts relative to calls. The skew became a permanent, pronounced feature of U.S. equity index options after the 1987 stock market crash, when the possibility of a sudden large decline became something the options market began pricing in explicitly, rather than assuming returns were roughly symmetric.
Skew Shapes Differ by Asset Class
Not every market shows the same skew shape. Commodities often show the opposite pattern — a stronger ‘smile’ or upward skew on the call side — because supply shocks tend to push commodity prices sharply higher rather than lower, making upside protection more in demand. Currency options are often quoted directly in terms of ‘risk reversals,’ a measure of the skew between equivalent out-of-the-money puts and calls, reflecting whichever direction the market currently sees as the bigger tail risk.
| Asset Class | Typical Skew Shape | Primary Driver |
|---|---|---|
| Equity Indices | Downward skew (puts pricier than calls) | Demand for crash/downside protection |
| Commodities | Upward skew or smile (calls can be pricier) | Supply-shock risk pushes prices sharply higher |
| FX (Currency Pairs) | Varies by pair, quoted as risk reversals | Whichever direction carries the larger perceived tail risk |
Frequently Asked Questions
Is volatility skew the same as the volatility smile?
They are related but distinct. A volatility ‘smile’ refers to a symmetric pattern where both out-of-the-money puts and calls trade at higher implied volatility than at-the-money options. A ‘skew’ or ‘smirk’ refers to an asymmetric version of that pattern, where one side (commonly the put side, for equity indices) is priced noticeably richer than the other.
How can traders use volatility skew?
Some options strategies are built specifically around skew — for example, selling relatively expensive downside puts and buying relatively cheap upside calls (a risk reversal), or comparing an option’s implied volatility to where it has historically sat on the skew curve to judge whether it looks rich or cheap relative to nearby strikes, not just relative to its own history.
Does skew change over time?
Yes. Skew steepens noticeably during periods of market stress, when demand for downside protection surges, and tends to flatten somewhat during calm, low-volatility periods — though for equity indices it rarely disappears entirely.
Why doesn’t Black-Scholes account for skew?
The original Black-Scholes model assumes a single constant volatility applies to all strikes and expirations, essentially assuming returns are lognormally distributed with no extra weight on tail outcomes. Real markets price in fatter tails and asymmetric risk, which is precisely what shows up as skew rather than a flat implied volatility curve.
Key Takeaways
Volatility skew shows that options markets price downside and upside risk differently, not identically, and understanding the shape of that skew — rather than looking at a single implied volatility number — is essential for pricing, comparing, and structuring options positions accurately. This article is for informational purposes only and does not constitute investment advice.

QuantPro: AI Finds the Trade Before You Do
From AI-powered chart analysis to real-time market intelligence — everything a serious investor needs, in one platform.
- Automated AI chart analysis with precision trend timing
- Bull Radar: real-time visualization of geopolitical & economic shifts
- Live market-moving news and insights, curated for you
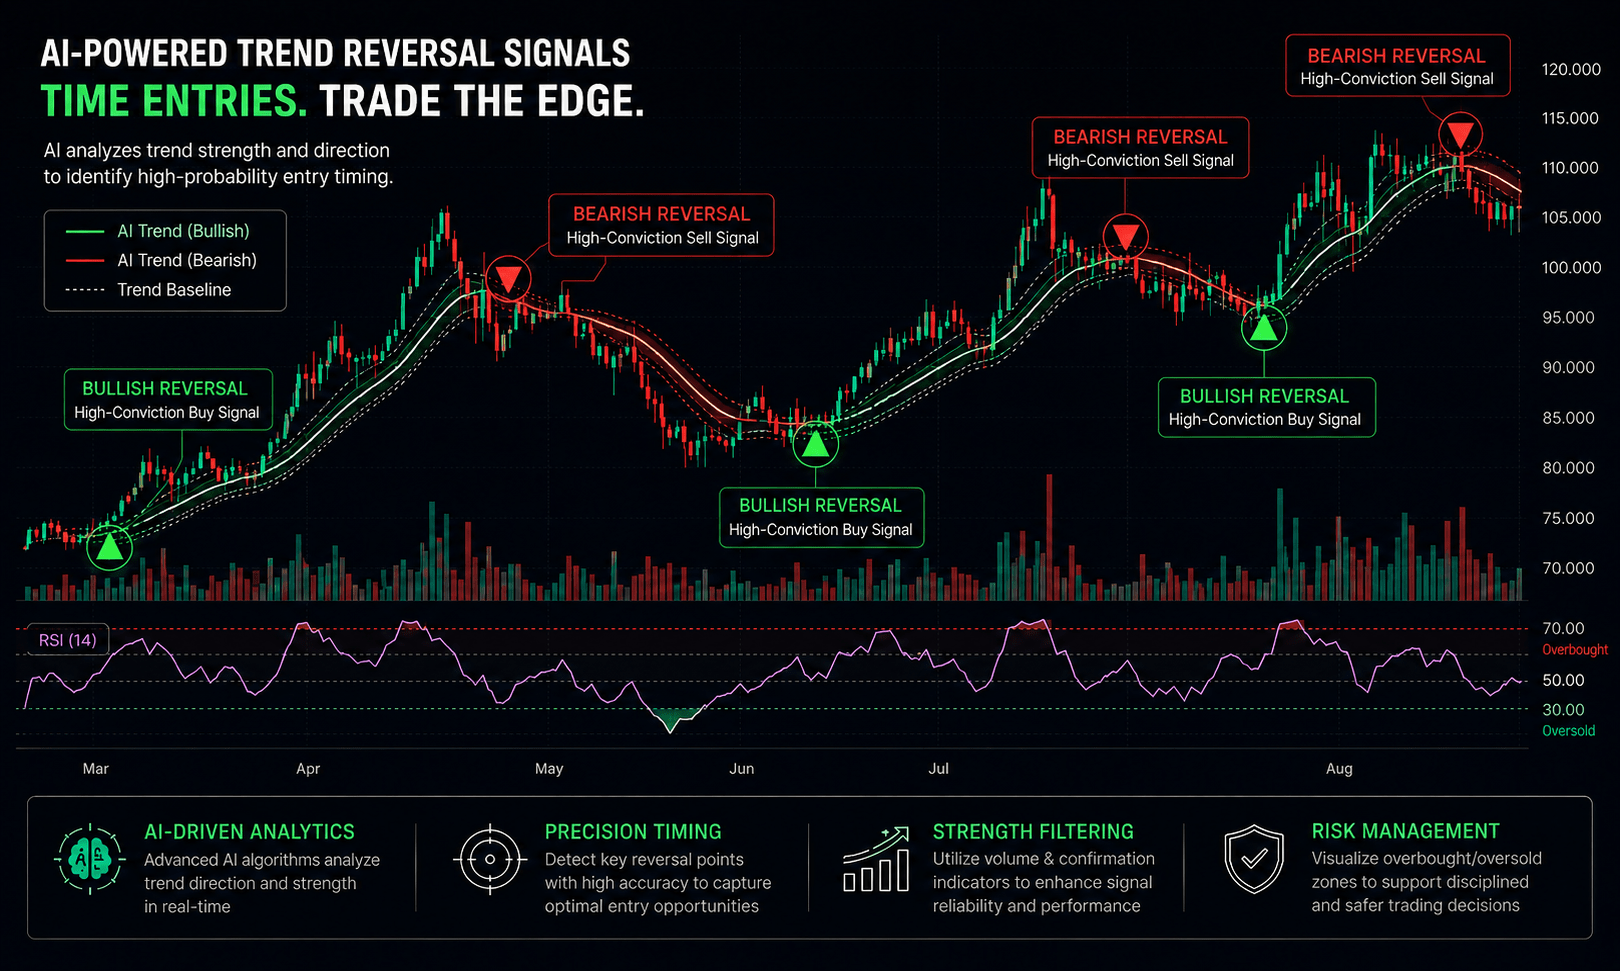
Bull Wave / Bear Wave Forecast Model
Engineered to help you read market direction and momentum faster than the crowd.
- Instantly separate bullish momentum from bearish pressure
- Pinpoint high-probability entry zones with confidence
- Chart signals clear enough for beginners, sharp enough for pros
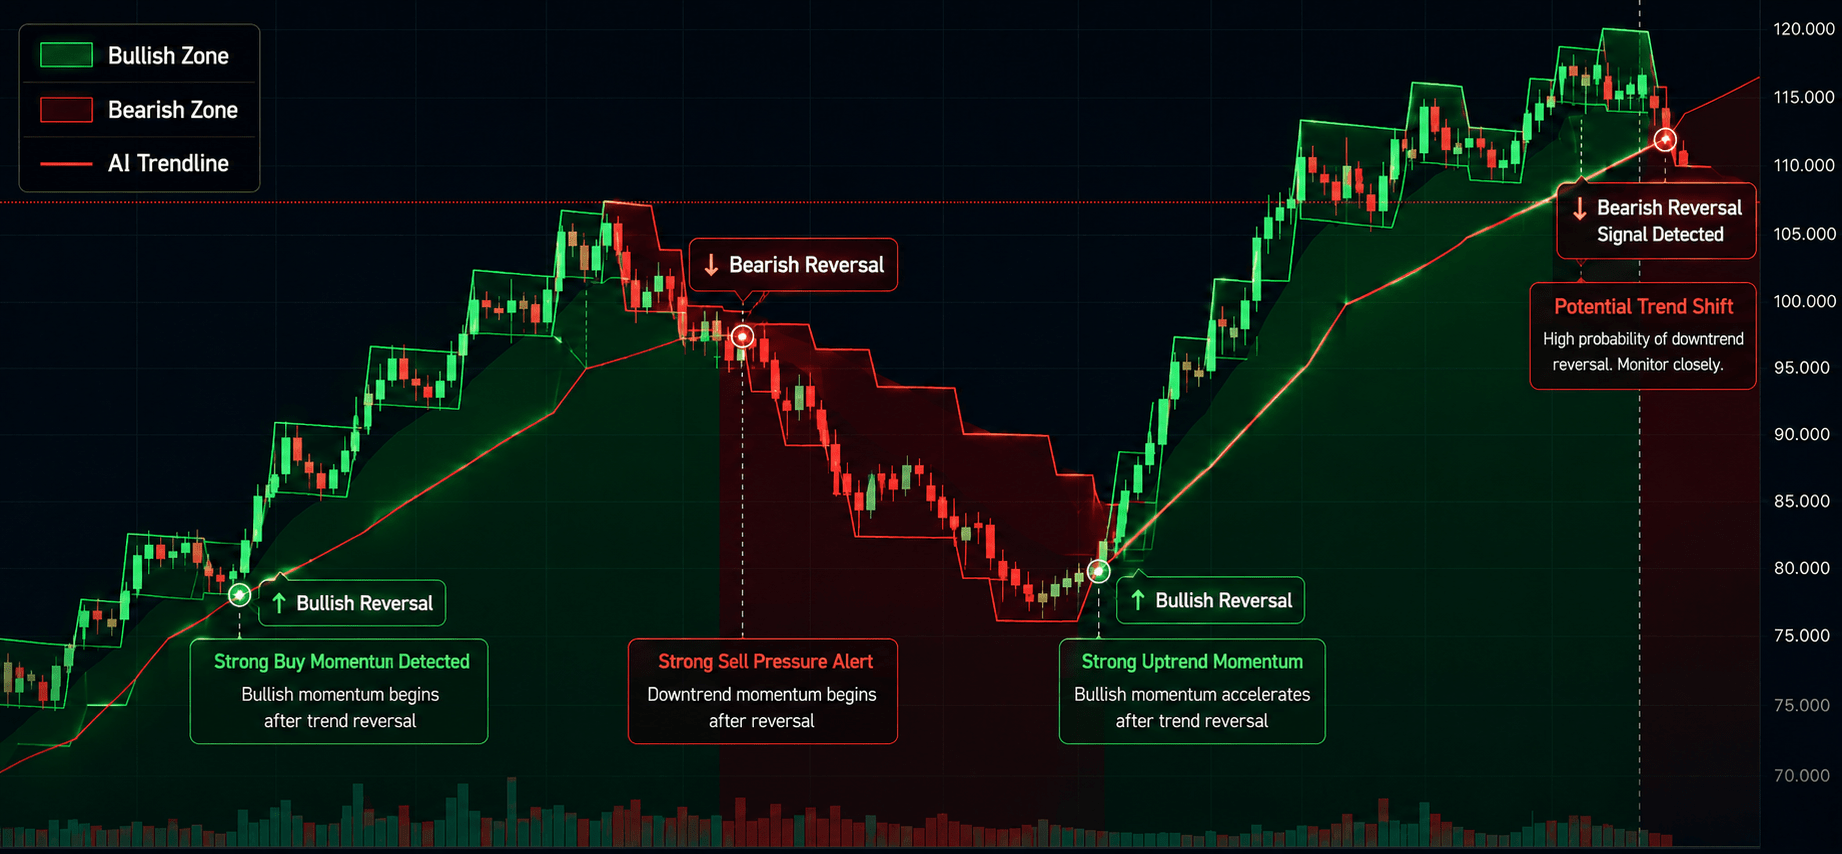
Winning Pattern Detection
Instantly surfaces the high-probability setups that repeat across the charts — a trusted edge for timing your entries and exits.
- Spot momentum building in real time
- Catch trend-reversal points before they break
- Built for active traders who need results, not theory
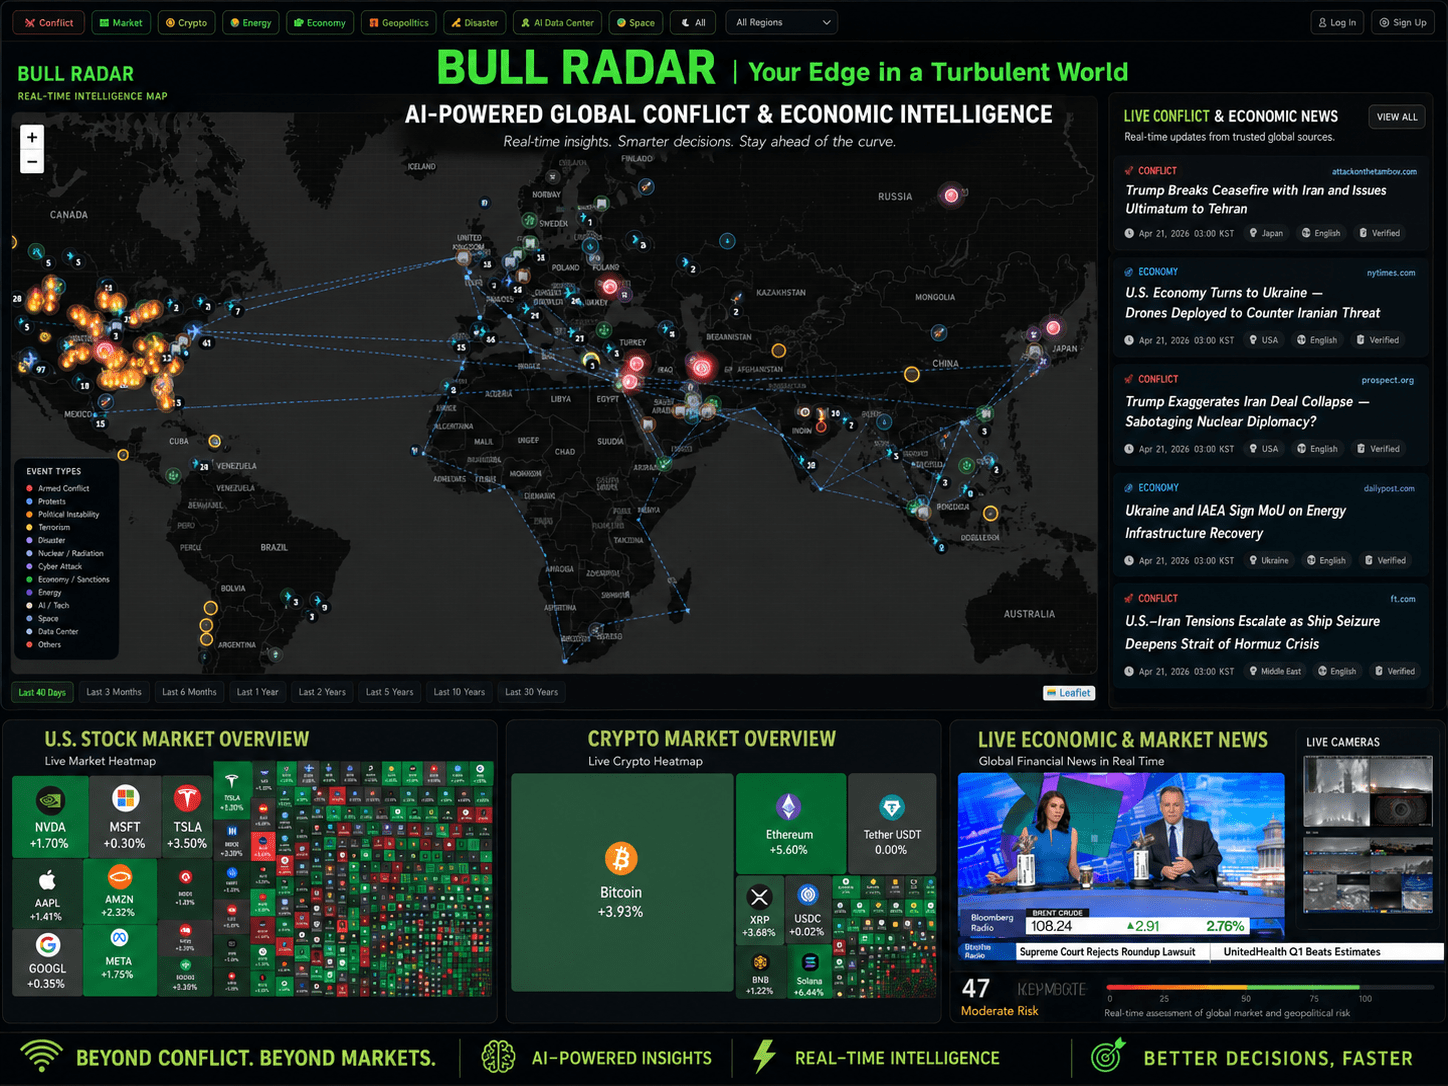
AI Live Economic Dashboard
AI analyzes real-time market data — turning complex, global investment flows into clear insight in seconds.
- Track global stock markets in real time
- See exactly which assets are strong — and which are fading
- Watch how geopolitical events move the markets
About the Author