What Is the Calmar Ratio?
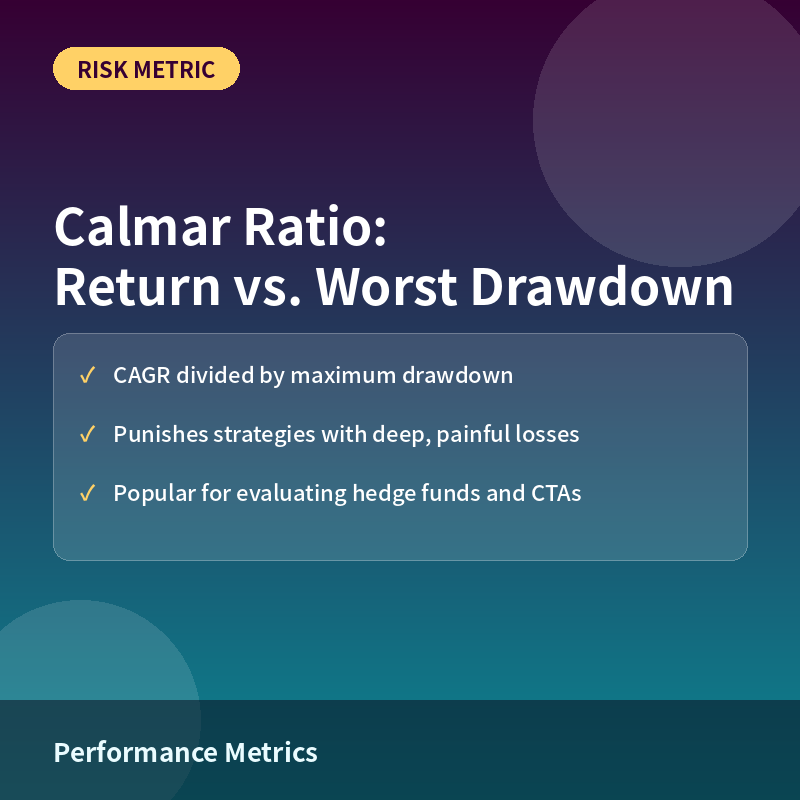
The Calmar ratio is a risk-adjusted performance measure that divides a fund’s compound annual growth rate (CAGR) by the absolute value of its maximum drawdown — the largest peak-to-trough decline it has experienced. It answers a specific question: how much annualized return did this strategy generate relative to the worst loss an investor would have had to sit through to earn it?
The Formula
Calmar Ratio = CAGR / |Maximum Drawdown|. Both figures are typically calculated over the same lookback period, commonly the trailing 36 months, though it can be computed over a fund’s full history. A higher Calmar ratio means more annualized return was earned per unit of the worst historical loss.
A Worked Example
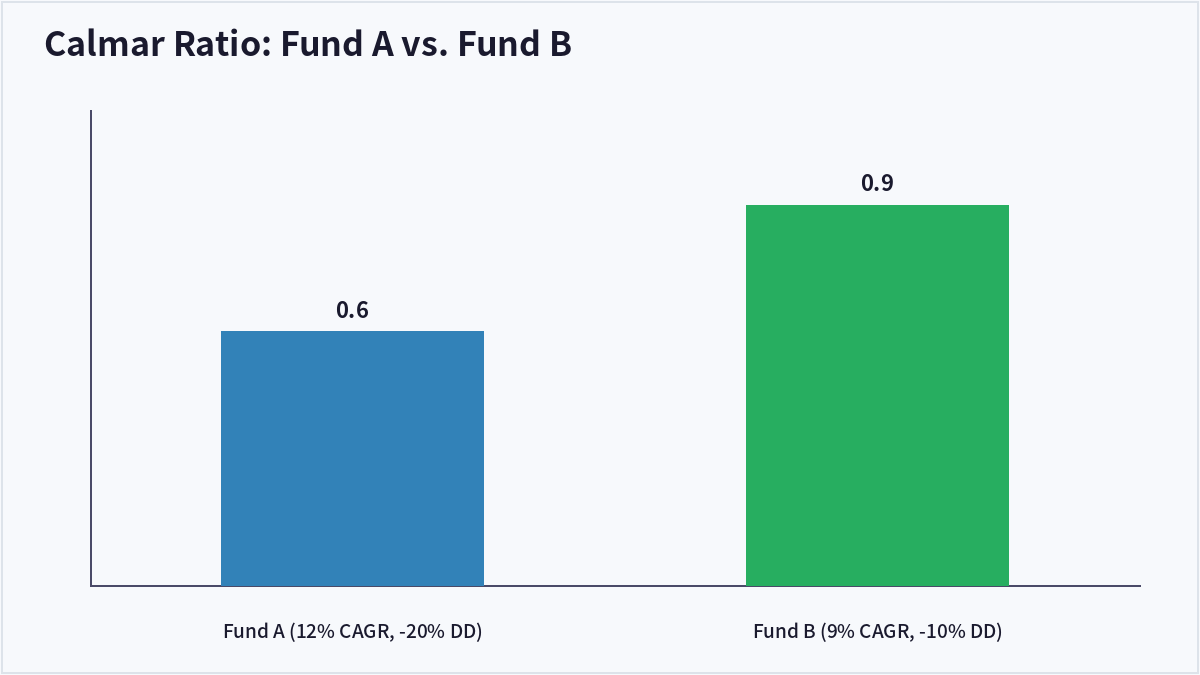
Consider two funds. Fund A has compounded at a 12% CAGR but suffered a maximum drawdown of -20% at its worst point. Fund B compounded at a lower 9% CAGR but its maximum drawdown was only -10%. Fund A’s Calmar ratio is 12 / 20 = 0.60. Fund B’s Calmar ratio is 9 / 10 = 0.90. Even though Fund A has the higher raw return, Fund B’s Calmar ratio is higher, meaning it delivered more return relative to the worst loss an investor had to endure.
Why Drawdown-Based Metrics Matter
Standard deviation-based metrics like the Sharpe ratio treat all volatility — both up and down moves — as equally undesirable. In practice, investors do not experience a sharp rally as painful the way they experience a sharp decline. The Calmar ratio focuses specifically on the single worst loss a strategy has produced, which tends to align more closely with what actually causes investors to panic-sell or redeem from a fund.
Calmar vs. Sharpe vs. Sortino
| Metric | Risk Measure Used | What It Penalizes |
|---|---|---|
| Sharpe Ratio | Total standard deviation | All volatility, up and down |
| Sortino Ratio | Downside deviation only | Volatility below a target return |
| Calmar Ratio | Maximum drawdown | The single worst peak-to-trough loss |
Frequently Asked Questions
Who typically uses the Calmar ratio?
It is especially common among managed futures funds, commodity trading advisors (CTAs), and hedge funds, where investors care heavily about tail losses and capital preservation, in addition to raw returns.
What counts as a ‘good’ Calmar ratio?
There is no universal threshold, since it depends on asset class and strategy type, but a Calmar ratio above 1.0 (meaning CAGR exceeds the maximum drawdown) is generally viewed as strong, while ratios below 0.5 suggest the strategy’s worst loss has been large relative to what it has earned.
Does the Calmar ratio account for how often drawdowns happen?
No. It only looks at the single deepest drawdown over the measurement period, not how frequently smaller drawdowns occur or how long they last — that is a limitation worth pairing with other measures like average drawdown or recovery time.
Can the Calmar ratio be negative?
Yes, if the CAGR itself is negative over the measurement period. A negative Calmar ratio simply reflects that the strategy lost money on a compound annualized basis during that window.
Key Takeaways
The Calmar ratio measures return per unit of a strategy’s worst historical drawdown, making it a useful complement to Sharpe and Sortino ratios for investors who care specifically about how deep the losses got, not just how volatile the returns were. This article is for informational purposes only and does not constitute investment advice.

QuantPro: AI Finds the Trade Before You Do
From AI-powered chart analysis to real-time market intelligence — everything a serious investor needs, in one platform.
- Automated AI chart analysis with precision trend timing
- Bull Radar: real-time visualization of geopolitical & economic shifts
- Live market-moving news and insights, curated for you

Bull Wave / Bear Wave Forecast Model
Engineered to help you read market direction and momentum faster than the crowd.
- Instantly separate bullish momentum from bearish pressure
- Pinpoint high-probability entry zones with confidence
- Chart signals clear enough for beginners, sharp enough for pros

Winning Pattern Detection
Instantly surfaces the high-probability setups that repeat across the charts — a trusted edge for timing your entries and exits.
- Spot momentum building in real time
- Catch trend-reversal points before they break
- Built for active traders who need results, not theory

AI Live Economic Dashboard
AI analyzes real-time market data — turning complex, global investment flows into clear insight in seconds.
- Track global stock markets in real time
- See exactly which assets are strong — and which are fading
- Watch how geopolitical events move the markets
About the Author