What a Volume Profile Is
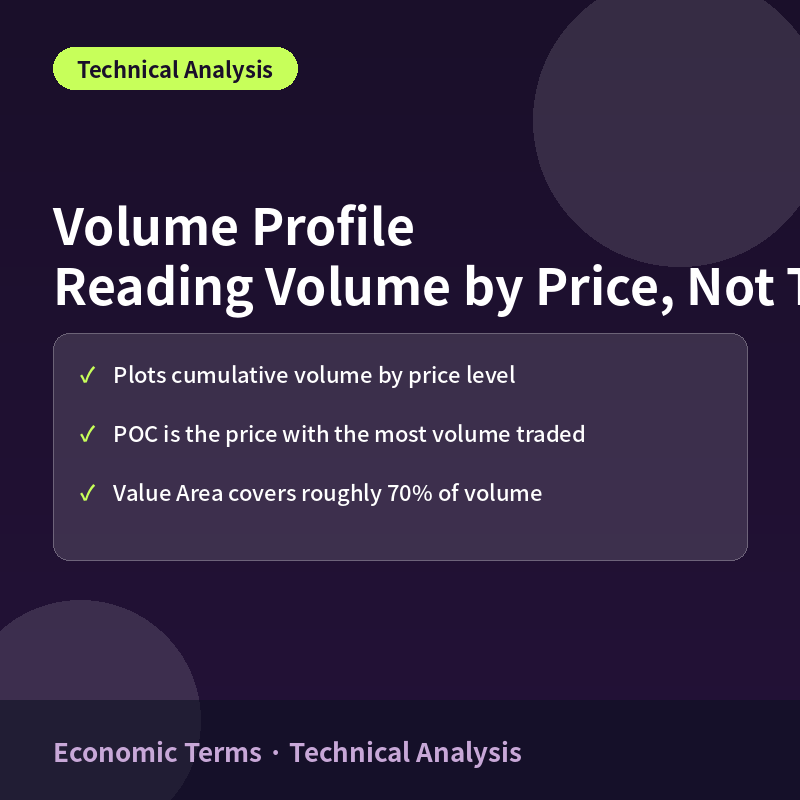
A volume profile is a charting tool that aggregates trading volume by price rather than by time, displaying it as a horizontal histogram. While a standard volume indicator shows when trading was heavy, a volume profile shows at which price levels trading was heavy.
Reading the POC and Value Area
The price level with the single highest traded volume is called the Point of Control (POC), often interpreted as the price the majority of market participants have implicitly agreed is ‘fair.’ The Value Area covers roughly 70% of total volume traded, and its upper and lower boundaries frequently act as resistance and support, respectively.

Applying Volume Profile to Trading
| Signal | Interpretation | Trading Idea |
|---|---|---|
| Price returns to the POC | A pull back toward the perceived fair price | Watch for a bounce or rejection near the POC |
| Breakout through a Low Volume Node (LVN) | Thin resting supply allows price to pass quickly | Expect an accelerated move once breached |
| Break above/below the Value Area | Market is searching for a new equilibrium price | Consider watching for a potential trend shift |
How It Differs From Standard Volume Indicators
A standard volume bar tied to the time axis tells you when trading was active but not at which prices. By rearranging that same information along the price axis, a volume profile lets traders identify support and resistance based on actual executed trades rather than round-number psychological levels.
Frequently Asked Questions
Does the POC always act as support or resistance?
It’s a probabilistically favored level, not a guarantee. Heavy traded volume reflects a price where many participants took positions, which tends to function as a psychological reference point, though not an absolute one.
What time frame should be used for a volume profile?
Short-term traders commonly use a session-based profile (a single day or a few days), while swing traders often use weekly to monthly profiles — the right window depends on the trading horizon.
Why do Low Volume Nodes matter?
Areas with little prior trading have thin resting supply, so price tends to move through them quickly, whereas High Volume Nodes (HVN) often see price linger or reverse, acting like resistance zones.
Should trading decisions rely on volume profile alone?
It’s generally better used alongside trend indicators or moving averages rather than in isolation, since volume profile indicates where a reaction might occur, not the direction of the next move.
Key Takeaways
Volume profile aggregates trading volume by price level to reveal the Point of Control and Value Area, offering support and resistance levels grounded in actual executed trades. Unlike standard time-based volume indicators, it shows exactly where — not just when — trading activity concentrated. This article is for informational purposes only and does not constitute investment advice.

QuantPro: AI Finds the Trade Before You Do
From AI-powered chart analysis to real-time market intelligence — everything a serious investor needs, in one platform.
- Automated AI chart analysis with precision trend timing
- Bull Radar: real-time visualization of geopolitical & economic shifts
- Live market-moving news and insights, curated for you

Bull Wave / Bear Wave Forecast Model
Engineered to help you read market direction and momentum faster than the crowd.
- Instantly separate bullish momentum from bearish pressure
- Pinpoint high-probability entry zones with confidence
- Chart signals clear enough for beginners, sharp enough for pros

Winning Pattern Detection
Instantly surfaces the high-probability setups that repeat across the charts — a trusted edge for timing your entries and exits.
- Spot momentum building in real time
- Catch trend-reversal points before they break
- Built for active traders who need results, not theory

AI Live Economic Dashboard
AI analyzes real-time market data — turning complex, global investment flows into clear insight in seconds.
- Track global stock markets in real time
- See exactly which assets are strong — and which are fading
- Watch how geopolitical events move the markets
About the Author