What Is the PEG Ratio
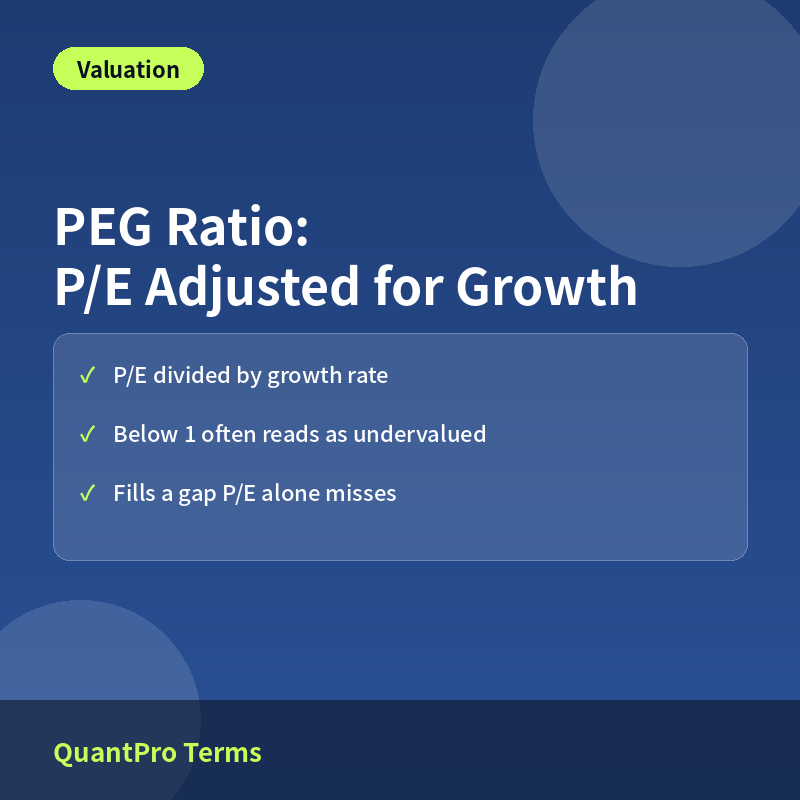
The PEG ratio (Price/Earnings to Growth) divides a stock’s price-to-earnings (P/E) ratio by its expected earnings growth rate, addressing a key limitation of using P/E alone as a measure of value. It’s a metric popularized in large part by legendary fund manager Peter Lynch.
Two stocks can share the same P/E ratio but have very different growth prospects, which means their true relative valuation can differ sharply. The PEG ratio incorporates growth into the picture, helping investors judge whether a seemingly ‘cheap’ stock is genuinely inexpensive relative to how fast it’s growing.
How the PEG Ratio Is Calculated
The formula is P/E divided by the expected annual earnings growth rate (expressed as a whole number percentage). Conventionally, a PEG ratio below 1 suggests a stock may be undervalued relative to its growth, while a PEG above 1 suggests it may be overvalued relative to its growth.
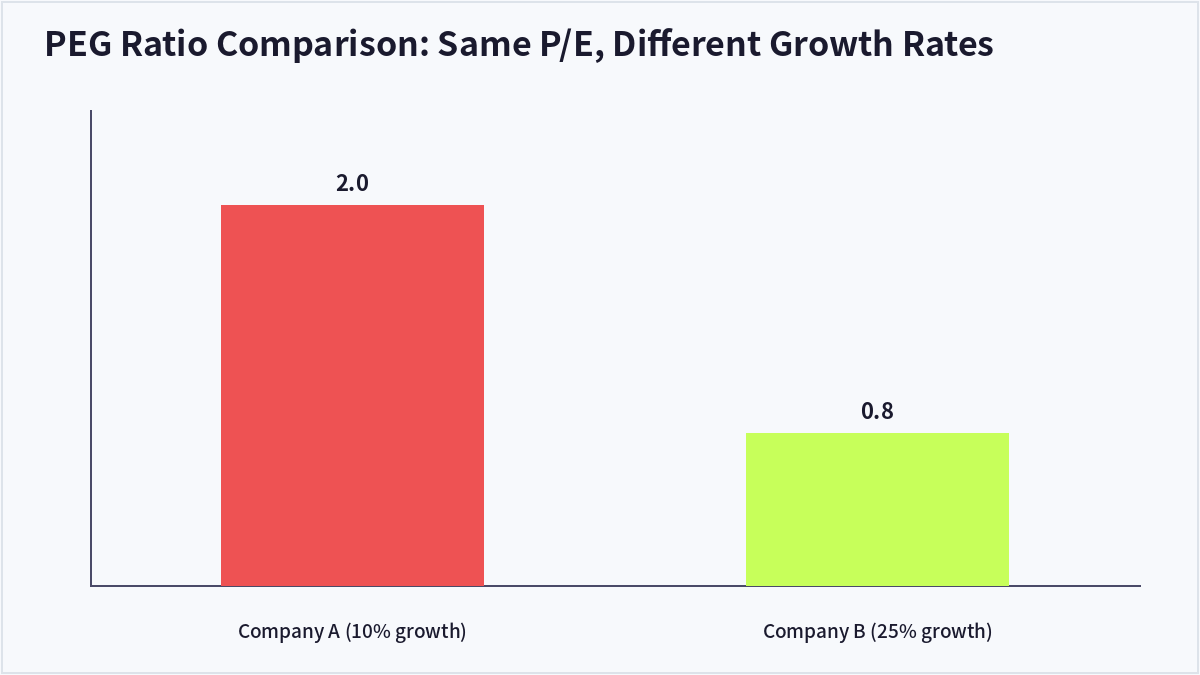
Consider Company A, trading at a P/E of 20 with a 10% growth rate, giving a PEG of 2.0 (20÷10) — suggesting it’s somewhat expensive relative to growth. Company B also trades at a P/E of 20 but grows at 25%, giving a PEG of 0.8 (20÷25) — suggesting it’s actually cheap relative to growth. Even though both share the same P/E, factoring in growth completely changes the picture.
Limitations to Keep in Mind
The PEG ratio’s usefulness depends heavily on the accuracy of the growth rate used, which is typically based on analyst estimates or historical averages — both of which are inherently uncertain. If actual growth comes in lower than projected, a stock that looked cheap on a PEG basis could turn out to have been overvalued all along.
PEG is also difficult to apply meaningfully to unprofitable companies or those with highly volatile earnings, so it tends to be most useful when comparing stable, profitable growth companies against one another.
| Company | P/E | Expected Growth | PEG Ratio | Interpretation |
|---|---|---|---|---|
| Company A | 20x | 10% | 2.0 | Expensive relative to growth |
| Company B | 20x | 25% | 0.8 | Cheap relative to growth |
Frequently Asked Questions
Is a lower PEG ratio always a better investment?
It can suggest undervaluation, but the result is only as reliable as the growth estimate used. It’s best to combine PEG with other metrics rather than relying on it alone.
What kinds of stocks is PEG most useful for?
It’s particularly useful for comparing profitable growth or tech stocks against each other, but loses much of its discriminating power for mature, low-growth industries.
What growth rate figure is typically used?
Analyst consensus estimates for the next 1-3 years are common, though some investors substitute a historical 3-5 year average growth rate — it’s important to check which basis was used.
Does a PEG ratio of exactly 1 mean fair value?
It’s a conventional rule of thumb rather than an absolute standard. Comparing PEG against industry averages or direct competitors gives more meaningful context than the number alone.
Key Takeaways
The PEG ratio adjusts P/E for a company’s growth rate, helping investors judge whether a stock is genuinely cheap relative to its growth prospects rather than just its price. Its reliability depends heavily on the accuracy of the growth estimate used, so it works best alongside other valuation tools. This article is for informational purposes only and does not constitute investment advice.

QuantPro: AI Finds the Trade Before You Do
From AI-powered chart analysis to real-time market intelligence — everything a serious investor needs, in one platform.
- Automated AI chart analysis with precision trend timing
- Bull Radar: real-time visualization of geopolitical & economic shifts
- Live market-moving news and insights, curated for you

Bull Wave / Bear Wave Forecast Model
Engineered to help you read market direction and momentum faster than the crowd.
- Instantly separate bullish momentum from bearish pressure
- Pinpoint high-probability entry zones with confidence
- Chart signals clear enough for beginners, sharp enough for pros

Winning Pattern Detection
Instantly surfaces the high-probability setups that repeat across the charts — a trusted edge for timing your entries and exits.
- Spot momentum building in real time
- Catch trend-reversal points before they break
- Built for active traders who need results, not theory

AI Live Economic Dashboard
AI analyzes real-time market data — turning complex, global investment flows into clear insight in seconds.
- Track global stock markets in real time
- See exactly which assets are strong — and which are fading
- Watch how geopolitical events move the markets
About the Author