What Is M2 Money Supply?
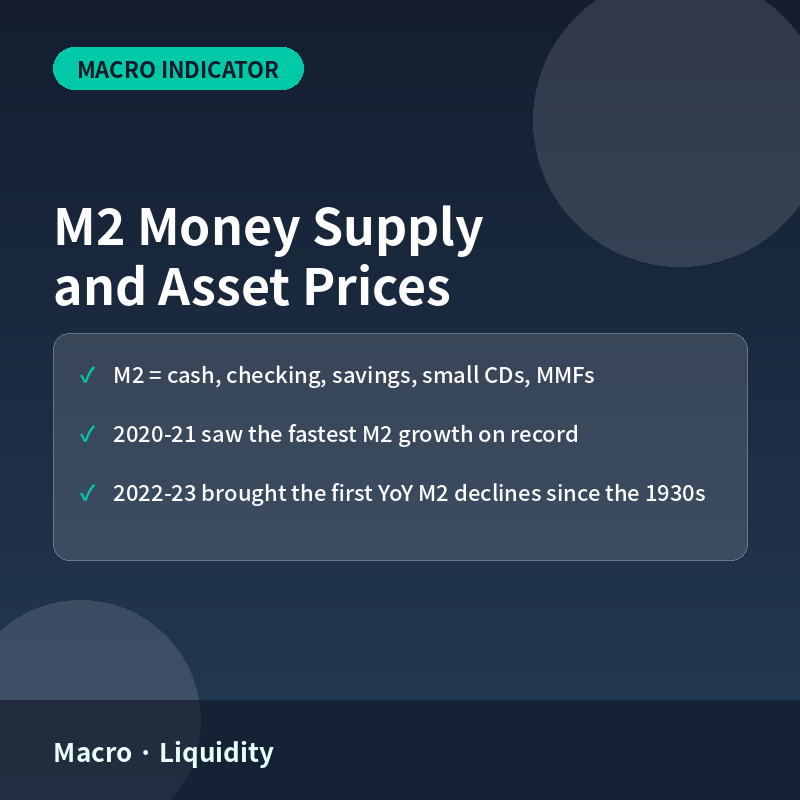
M2 is a measure of the money supply that includes M1 (physical currency in circulation plus checking deposits) plus savings deposits, small-denomination time deposits (under $100,000), and retail money market mutual fund balances. It is the most widely watched broad money-supply gauge because it captures cash and near-cash assets that households and businesses can access relatively quickly to spend or invest.
Why M2 Growth Matters for Markets
Liquidity and Asset Prices
When M2 grows quickly, more money is circulating through the financial system relative to the supply of goods, services, and investable assets. That extra liquidity has to go somewhere, and a portion of it historically flows into financial assets — stocks, real estate, and, in the 2020s, cryptocurrencies — pushing prices up even before it shows up as consumer-price inflation. When M2 growth slows sharply or turns negative, that liquidity tailwind fades or reverses.
The 2020-2023 Case Study
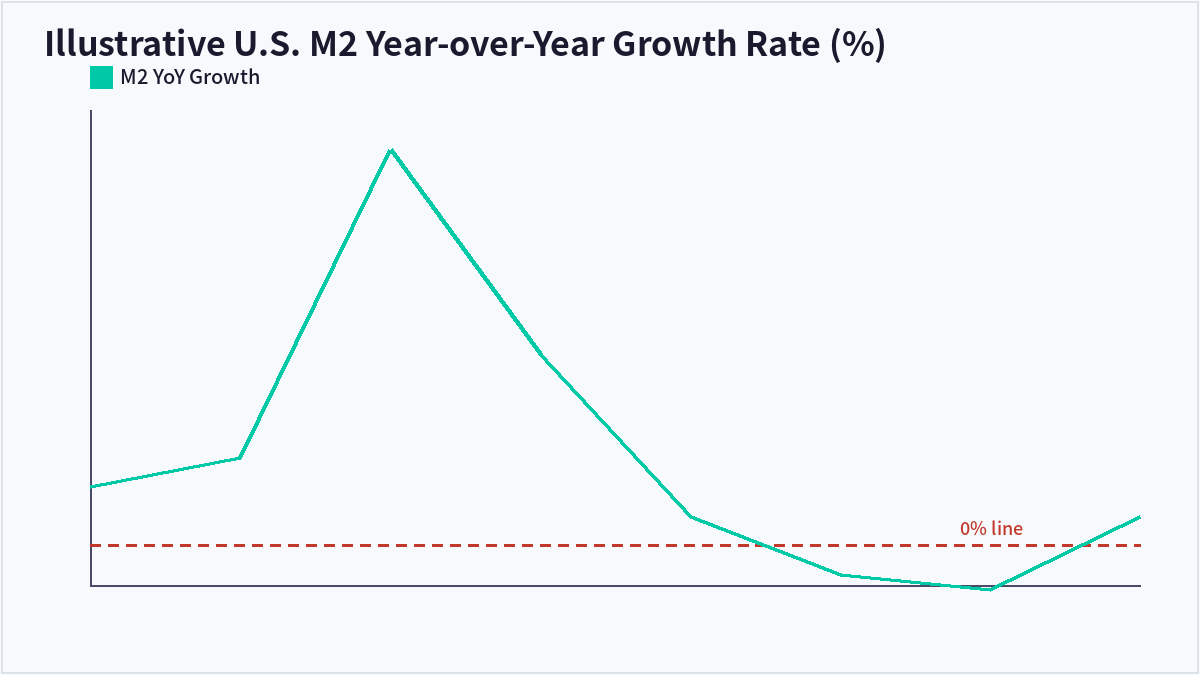
U.S. M2 grew at roughly 27% year-over-year at its 2021 peak — the fastest pace on record — driven by pandemic-era fiscal stimulus and Federal Reserve asset purchases. Growth decelerated sharply through 2022 as the Fed reversed course with rate hikes and quantitative tightening, and by 2023 M2 posted its first sustained year-over-year declines since the Great Depression era. Equity and crypto markets that had rallied hard through the 2020-2021 liquidity surge saw a difficult stretch in 2022 as that growth rate collapsed.
A Lagging, Imperfect Signal
M2 growth is a useful backdrop indicator, not a precise timing tool. It tends to lag the Fed’s actual policy stance by months, and the relationship between M2 and asset prices is a correlation observed across cycles rather than a fixed, mechanical formula — other factors like earnings, interest rates, and investor sentiment interact with liquidity conditions at the same time.
M1 vs. M2 vs. M3
| Measure | Includes | Liquidity |
|---|---|---|
| M1 | Cash in circulation + checking (demand) deposits | Highest — immediately spendable |
| M2 | M1 + savings deposits, small time deposits, retail money market funds | High — accessible within a short period |
| M3 (no longer published by the Fed) | M2 + large time deposits, institutional money funds, repos | Lower — includes less liquid institutional funding |
Frequently Asked Questions
Does rising M2 always cause inflation?
Not immediately or automatically. The relationship between money supply growth and consumer-price inflation depends on how quickly that money circulates (its velocity) and whether it flows into spending, saving, or financial assets. Money supply growth is one input among many, not a standalone predictor.
Where can I find M2 data?
The Federal Reserve publishes M2 data regularly, and it is freely available through the Federal Reserve Economic Data (FRED) database maintained by the Federal Reserve Bank of St. Louis.
Why did M2 growth turn negative in 2022-2023?
As pandemic-era fiscal stimulus faded and the Federal Reserve raised interest rates while shrinking its balance sheet through quantitative tightening, the extraordinary money creation of 2020-2021 was partially unwound, producing year-over-year declines in the M2 measure.
Is M2 growth a leading or lagging indicator for stocks?
It is generally treated as a coincident-to-lagging liquidity backdrop rather than a precise leading indicator; investors watch its rate of change alongside Fed policy signals rather than using it in isolation to time entries or exits.
Key Takeaways
M2 money supply growth is a widely watched proxy for liquidity conditions in the financial system, and its historic 2020-2021 surge followed by a 2022-2023 contraction offers a clear real-world illustration of how liquidity cycles can align with asset-market cycles — though the relationship is a backdrop factor, not a precise trading signal. This article is for informational purposes only and does not constitute investment advice.

QuantPro: AI Finds the Trade Before You Do
From AI-powered chart analysis to real-time market intelligence — everything a serious investor needs, in one platform.
- Automated AI chart analysis with precision trend timing
- Bull Radar: real-time visualization of geopolitical & economic shifts
- Live market-moving news and insights, curated for you

Bull Wave / Bear Wave Forecast Model
Engineered to help you read market direction and momentum faster than the crowd.
- Instantly separate bullish momentum from bearish pressure
- Pinpoint high-probability entry zones with confidence
- Chart signals clear enough for beginners, sharp enough for pros

Winning Pattern Detection
Instantly surfaces the high-probability setups that repeat across the charts — a trusted edge for timing your entries and exits.
- Spot momentum building in real time
- Catch trend-reversal points before they break
- Built for active traders who need results, not theory

AI Live Economic Dashboard
AI analyzes real-time market data — turning complex, global investment flows into clear insight in seconds.
- Track global stock markets in real time
- See exactly which assets are strong — and which are fading
- Watch how geopolitical events move the markets
About the Author