What Is the Sharpe Ratio?
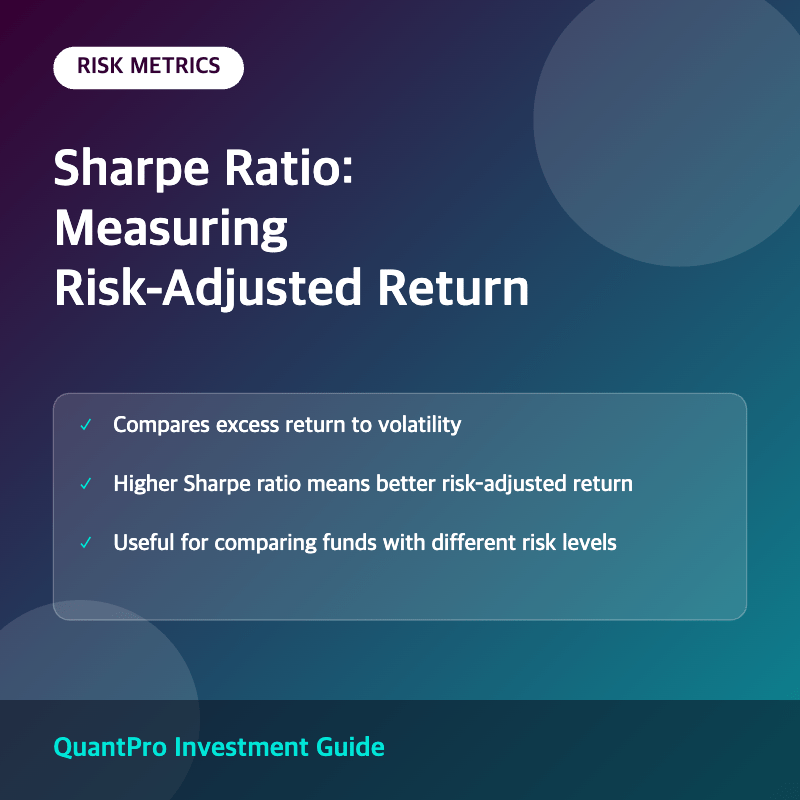
The Sharpe ratio is a widely used metric that measures an investment’s risk-adjusted return by comparing its excess return over a risk-free rate to its volatility, measured as standard deviation. Developed by Nobel laureate William Sharpe, it helps investors evaluate whether a portfolio’s returns are the result of smart investment decisions or simply excessive risk-taking.
The formula subtracts the risk-free rate, such as the yield on a short-term Treasury bill, from the portfolio’s return, then divides that excess return by the portfolio’s standard deviation. A higher Sharpe ratio indicates more return generated per unit of risk taken.
Why Risk-Adjusted Return Matters
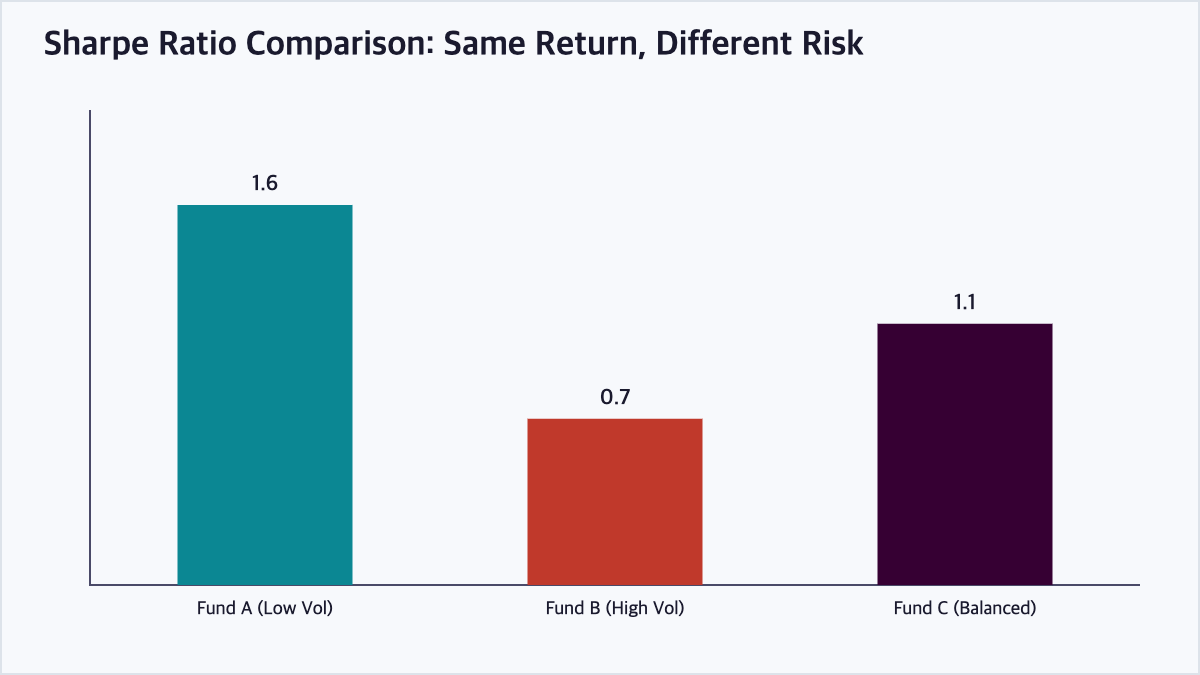
Raw returns alone can be misleading, since a fund that earns 15% with wild price swings may be a worse investment on a risk-adjusted basis than a fund earning 10% with much more stable, predictable returns. The Sharpe ratio allows investors to compare funds, strategies, or portfolios on a level playing field.
Interpreting Sharpe Ratio Values
As a general guideline, a Sharpe ratio below 1.0 is often considered suboptimal, a ratio between 1.0 and 2.0 is considered good, and a ratio above 2.0 is considered excellent, though these benchmarks can vary depending on asset class and market conditions.
Limitations of the Sharpe Ratio
The Sharpe ratio assumes returns are normally distributed and treats all volatility, both upside and downside, as equally undesirable, which can understate risk for investments with large occasional losses or overstate risk for those with occasional large gains. Metrics like the Sortino ratio, which considers only downside volatility, are sometimes used to address this limitation.
Sharpe Ratio vs Other Risk-Adjusted Metrics
| Metric | What It Measures | Key Difference |
|---|---|---|
| Sharpe Ratio | Return per unit of total volatility | Penalizes upside and downside equally |
| Sortino Ratio | Return per unit of downside volatility | Ignores upside volatility |
| Treynor Ratio | Return per unit of systematic risk (beta) | Uses beta instead of standard deviation |
| Alpha | Excess return vs a benchmark | Not a ratio; measures outperformance directly |
Frequently Asked Questions
What is considered a good Sharpe ratio?
A Sharpe ratio above 1.0 is generally viewed as acceptable, above 2.0 as very good, and above 3.0 as excellent, though the appropriate benchmark can vary by asset class, time period, and the comparison group being used.
Can the Sharpe ratio be negative?
Yes. A negative Sharpe ratio occurs when a portfolio’s return is lower than the risk-free rate, indicating that an investor would have been better off holding a risk-free asset like Treasury bills instead of taking on the portfolio’s risk.
Is the Sharpe ratio useful for comparing different asset classes?
It can be, but caution is warranted since different asset classes may have return distributions that violate the normal distribution assumption underlying the Sharpe ratio, making direct comparisons across very different asset types less precise.
How is the Sharpe ratio calculated in practice?
It is calculated by subtracting the risk-free rate from the portfolio’s average return over a chosen period, then dividing that result by the standard deviation of the portfolio’s returns over the same period, typically annualized for comparability.
Key Takeaways
The Sharpe ratio provides a standardized way to evaluate whether an investment’s returns adequately compensate for the risk taken, making it a valuable tool for comparing funds and strategies with different volatility profiles. This article is for informational purposes only and does not constitute investment advice.

QuantPro: AI Finds the Trade Before You Do
From AI-powered chart analysis to real-time market intelligence — everything a serious investor needs, in one platform.
- Automated AI chart analysis with precision trend timing
- Bull Radar: real-time visualization of geopolitical & economic shifts
- Live market-moving news and insights, curated for you

Bull Wave / Bear Wave Forecast Model
Engineered to help you read market direction and momentum faster than the crowd.
- Instantly separate bullish momentum from bearish pressure
- Pinpoint high-probability entry zones with confidence
- Chart signals clear enough for beginners, sharp enough for pros

Winning Pattern Detection
Instantly surfaces the high-probability setups that repeat across the charts — a trusted edge for timing your entries and exits.
- Spot momentum building in real time
- Catch trend-reversal points before they break
- Built for active traders who need results, not theory

AI Live Economic Dashboard
AI analyzes real-time market data — turning complex, global investment flows into clear insight in seconds.
- Track global stock markets in real time
- See exactly which assets are strong — and which are fading
- Watch how geopolitical events move the markets
About the Author