What Are Support and Resistance Levels?
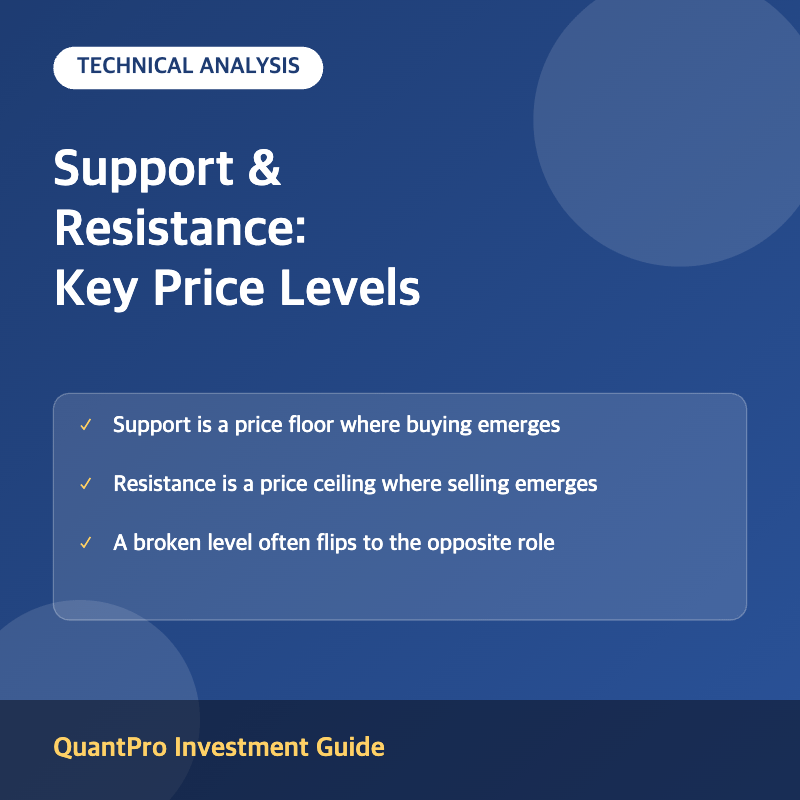
Support and resistance are price levels on a chart where a security has historically struggled to fall below (support) or rise above (resistance), reflecting concentrations of buying or selling interest. These levels form the foundation of much of technical analysis, helping traders identify potential entry and exit points.
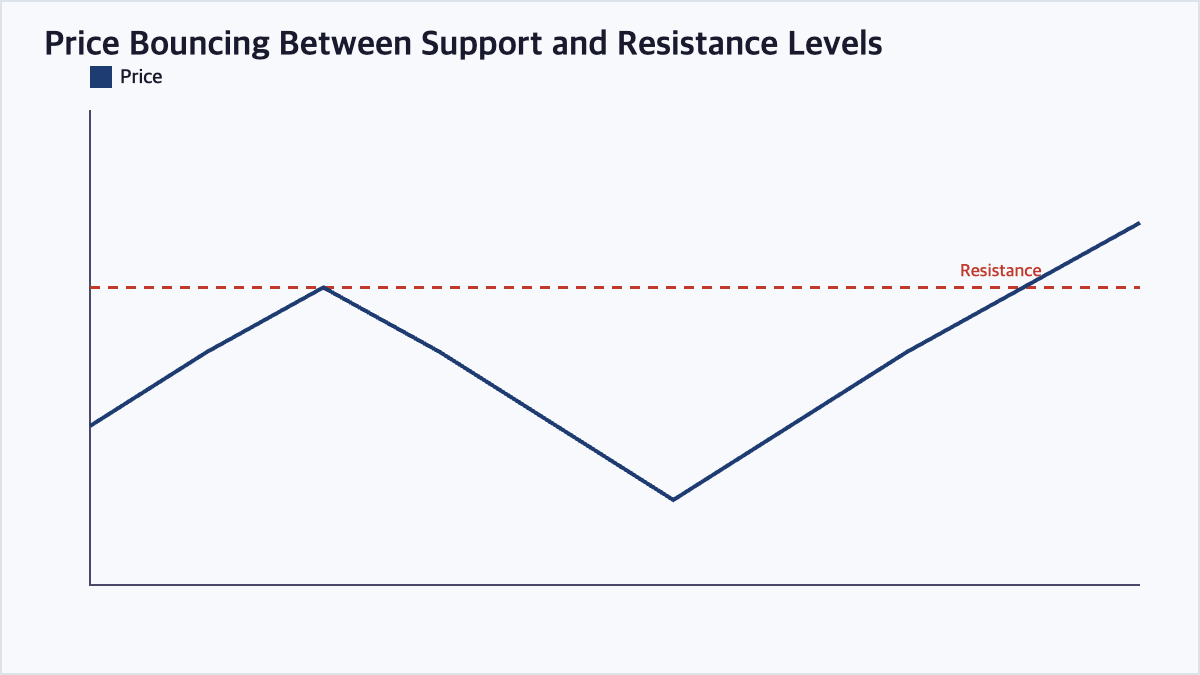
Support represents a price floor where buying pressure has previously overcome selling pressure, causing the price to stop declining and often bounce upward. Resistance represents a price ceiling where selling pressure has previously overcome buying pressure, causing the price to stall or reverse downward.
Why These Levels Form
Support and resistance levels often form near prior highs, prior lows, round psychological numbers, or areas of heavy historical trading volume, since many market participants remember these levels and place orders around them, reinforcing their significance over time.
Role Reversal: When Support Becomes Resistance
A key technical analysis concept is that once a support level is decisively broken, it often becomes a new resistance level, and vice versa. This happens because traders who bought at the old support level may look to sell and break even if the price returns to that level, creating new selling pressure exactly where buying pressure once existed.
Confirming Breakouts and Breakdowns
A breakout above resistance or a breakdown below support is more reliable when accompanied by strong trading volume, since volume confirms genuine participation behind the move rather than a temporary or false breakout that quickly reverses.
Support and Resistance: Key Characteristics
| Aspect | Support | Resistance |
|---|---|---|
| Definition | Price floor, buying overcomes selling | Price ceiling, selling overcomes buying |
| Typical Reaction | Price bounces upward | Price stalls or reverses downward |
| After a Break | Often becomes new resistance | Often becomes new support |
| Confirmation | Multiple touches, volume on bounce | Multiple touches, volume on rejection |
Frequently Asked Questions
How many times must a level be tested to be considered valid?
There is no fixed rule, but many technical analysts consider a level more significant after it has been tested and held at least two or three times, since repeated respect for the level suggests it reflects a genuine consensus price point among market participants.
What causes a false breakout?
A false breakout occurs when price briefly moves beyond a support or resistance level, triggering trades, but then quickly reverses back within the prior range, often due to insufficient volume or a temporary imbalance rather than a genuine shift in supply and demand.
Are support and resistance levels exact prices or zones?
In practice, these levels often behave more like zones than precise prices, since different traders may draw the level slightly differently, and price can wick slightly beyond a level before reversing, so many analysts treat them as an approximate range.
Can support and resistance be used alongside other indicators?
Yes. Support and resistance are commonly combined with volume, moving averages, and candlestick patterns to build higher-confidence trading signals, since confirmation from multiple independent tools reduces the risk of acting on a false signal.
Key Takeaways
Support and resistance levels mark price zones where buying or selling pressure has historically been strong enough to reverse or stall a trend, and a broken level frequently reverses its role. Combining these levels with volume and other indicators improves the reliability of trading decisions. This article is for informational purposes only and does not constitute investment advice.

QuantPro: AI Finds the Trade Before You Do
From AI-powered chart analysis to real-time market intelligence — everything a serious investor needs, in one platform.
- Automated AI chart analysis with precision trend timing
- Bull Radar: real-time visualization of geopolitical & economic shifts
- Live market-moving news and insights, curated for you

Bull Wave / Bear Wave Forecast Model
Engineered to help you read market direction and momentum faster than the crowd.
- Instantly separate bullish momentum from bearish pressure
- Pinpoint high-probability entry zones with confidence
- Chart signals clear enough for beginners, sharp enough for pros

Winning Pattern Detection
Instantly surfaces the high-probability setups that repeat across the charts — a trusted edge for timing your entries and exits.
- Spot momentum building in real time
- Catch trend-reversal points before they break
- Built for active traders who need results, not theory

AI Live Economic Dashboard
AI analyzes real-time market data — turning complex, global investment flows into clear insight in seconds.
- Track global stock markets in real time
- See exactly which assets are strong — and which are fading
- Watch how geopolitical events move the markets
About the Author