What Is Value at Risk (VaR)?
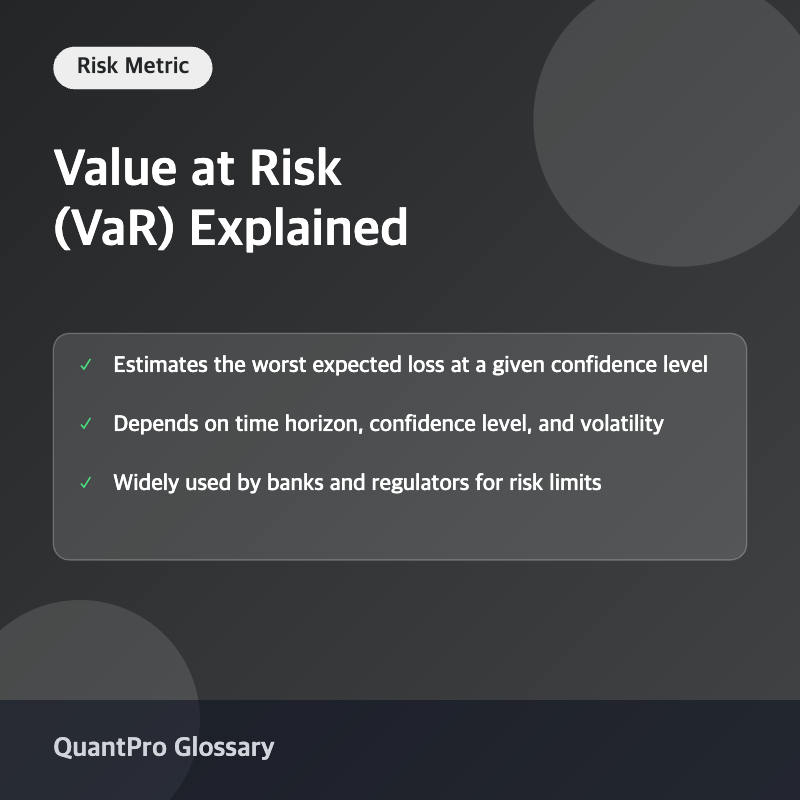
Value at Risk (VaR) is a statistical measure that estimates the maximum loss a portfolio is expected to experience over a given time horizon, at a specified confidence level, under normal market conditions. For example, a 1-day 95% VaR of $25,000 means there is a 95% chance that the portfolio will not lose more than $25,000 over the next trading day.
The Three Key Inputs: Confidence Level, Time Horizon, Loss Amount
Every VaR figure is defined by three components: the confidence level (commonly 95% or 99%), the time horizon over which the loss is measured (often one day or ten days), and the resulting dollar or percentage loss amount. Changing any one of these three inputs changes the resulting VaR figure, so a VaR number is meaningless without stating all three.
How Is VaR Calculated?
A Worked Example (Parametric Method)
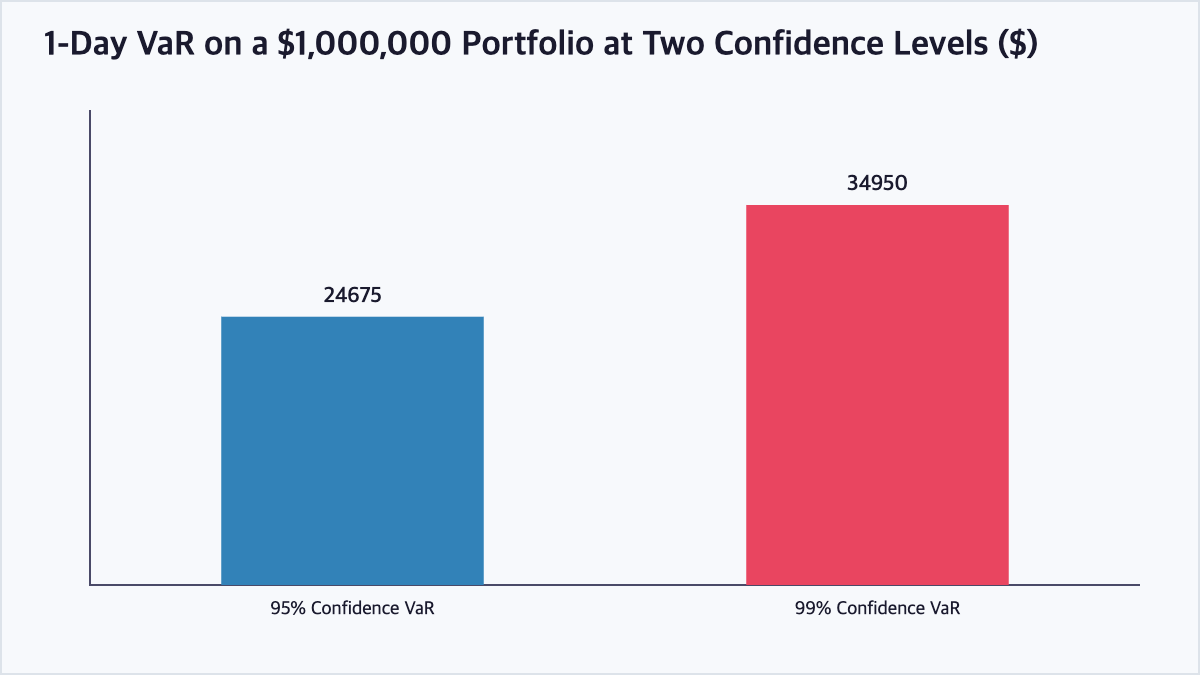
Consider a $1,000,000 portfolio with an estimated daily volatility (standard deviation of returns) of 1.5%. Using the parametric method, VaR = Portfolio Value × Z-score × Daily Volatility. At a 95% confidence level, the Z-score is approximately 1.645, giving VaR = $1,000,000 × 1.645 × 1.5% = $24,675. At a 99% confidence level, the Z-score rises to about 2.33, giving VaR = $1,000,000 × 2.33 × 1.5% = $34,950 — a noticeably larger figure because a higher confidence level requires covering a more extreme tail outcome.
Three Common VaR Methodologies
Besides the parametric (variance-covariance) method shown above, VaR can also be estimated using the historical simulation method, which reorders actual past returns to find the relevant percentile loss, or the Monte Carlo method, which simulates thousands of random price paths based on assumed statistical properties. Each method makes different trade-offs between computational simplicity and the ability to capture non-normal return distributions.
Why VaR Matters
Risk Management and Regulatory Use
Banks, asset managers, and regulators use VaR to set position limits, allocate risk capital, and satisfy regulatory capital requirements such as those under the Basel framework. A single VaR number allows risk managers to compare and aggregate very different types of exposures — equities, bonds, derivatives — on a common scale.
| Confidence Level | Z-Score | 1-Day VaR (on $1M portfolio, 1.5% daily volatility) |
|---|---|---|
| 95% | 1.645 | $24,675 |
| 99% | 2.33 | $34,950 |
Frequently Asked Questions
Does VaR tell you the maximum possible loss?
No. VaR only estimates the loss threshold that should not be exceeded with a given probability (e.g., 95% or 99% of the time). It says nothing about how severe losses could be in the remaining tail scenarios — a key limitation that led to the development of Conditional VaR.
What’s the difference between historical, parametric, and Monte Carlo VaR?
Parametric VaR assumes returns follow a known distribution (typically normal) and uses a formula; historical VaR uses actual past return data without assuming a distribution shape; Monte Carlo VaR simulates a large number of hypothetical future price paths. Each has different strengths in handling volatility clustering and non-normal (fat-tailed) returns.
Why do banks and regulators use VaR?
VaR provides a single, standardized number that summarizes risk across diverse portfolios, making it useful for setting internal risk limits, calculating regulatory capital requirements, and communicating risk exposure to management and regulators.
What is Conditional VaR (CVaR) and how does it differ from VaR?
Conditional VaR (also called Expected Shortfall) estimates the average loss in the worst-case scenarios beyond the VaR threshold, addressing VaR’s blind spot about how bad losses could get in the extreme tail of the distribution.
Key Takeaways
Value at Risk quantifies the maximum expected loss over a defined time horizon at a chosen confidence level, and the worked example above shows how raising the confidence level from 95% to 99% meaningfully raises the estimated loss figure. Because VaR says nothing about losses beyond its threshold, it works best alongside complementary measures like Conditional VaR and stress testing. This article is for informational purposes only and does not constitute investment advice.

QuantPro: AI Finds the Trade Before You Do
From AI-powered chart analysis to real-time market intelligence — everything a serious investor needs, in one platform.
- Automated AI chart analysis with precision trend timing
- Bull Radar: real-time visualization of geopolitical & economic shifts
- Live market-moving news and insights, curated for you

Bull Wave / Bear Wave Forecast Model
Engineered to help you read market direction and momentum faster than the crowd.
- Instantly separate bullish momentum from bearish pressure
- Pinpoint high-probability entry zones with confidence
- Chart signals clear enough for beginners, sharp enough for pros

Winning Pattern Detection
Instantly surfaces the high-probability setups that repeat across the charts — a trusted edge for timing your entries and exits.
- Spot momentum building in real time
- Catch trend-reversal points before they break
- Built for active traders who need results, not theory

AI Live Economic Dashboard
AI analyzes real-time market data — turning complex, global investment flows into clear insight in seconds.
- Track global stock markets in real time
- See exactly which assets are strong — and which are fading
- Watch how geopolitical events move the markets
About the Author