What Is Average True Range (ATR)?
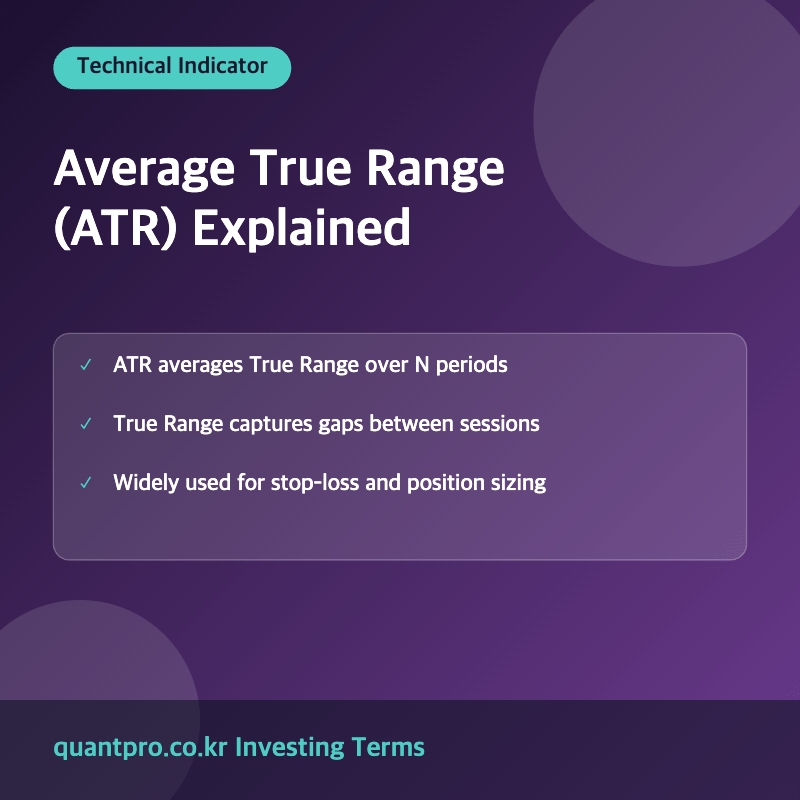
Average True Range (ATR) is a technical indicator developed by J. Welles Wilder that measures market volatility by calculating the average size of price movements over a given period. Unlike indicators that predict direction, ATR is purely a measure of how much an asset’s price is moving, making it a popular tool for setting stop-losses and sizing positions.
How ATR Is Calculated
The True Range Formula
True Range for a given period is the greatest of three values: the current high minus the current low, the absolute value of the current high minus the previous close, and the absolute value of the current low minus the previous close. Using the previous close captures any gap between sessions that a simple high-minus-low calculation would miss.
A Worked Example
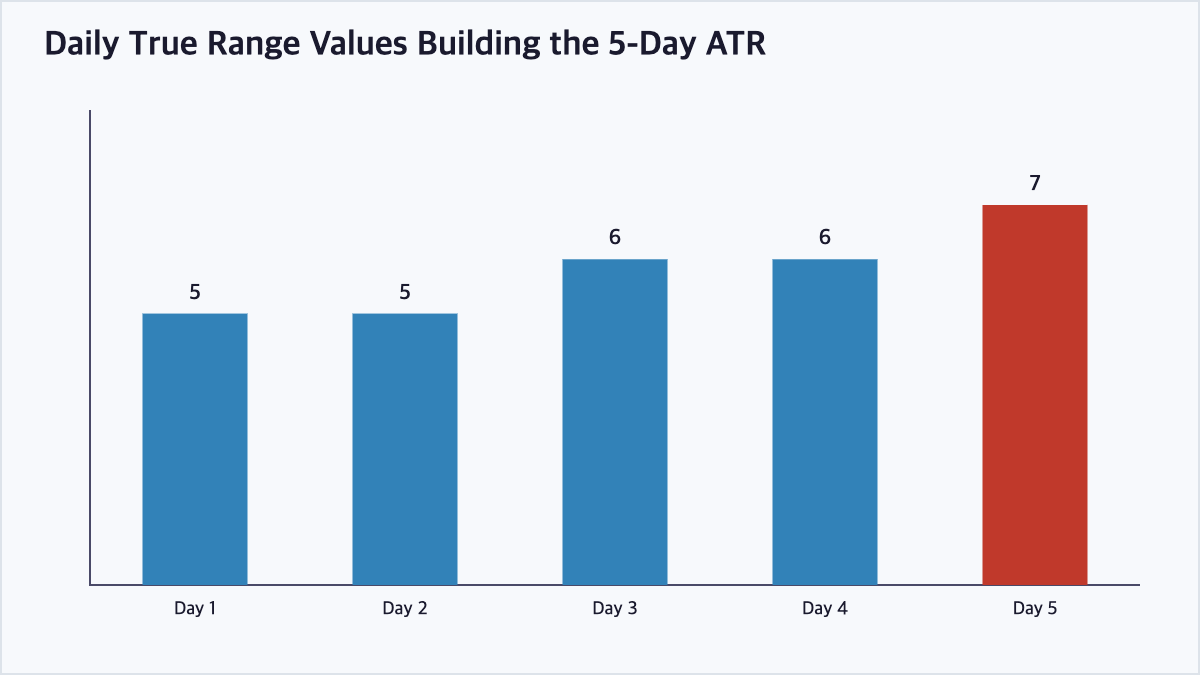
Suppose a stock’s daily True Range values over five days are 5, 5, 6, 6, and 7 points. A simple 5-day ATR is the average of these values: (5+5+6+6+7)÷5=5.8. In practice, ATR is usually smoothed using Wilder’s moving average method rather than a simple average, but the underlying logic — averaging the True Range over a set period — remains the same.
How Traders Use ATR
Setting Stop-Loss Levels
A common approach is to place a stop-loss a multiple of the ATR away from the entry price — for example, 2x ATR below entry for a long position — so the stop automatically adjusts to current volatility rather than using a fixed dollar or percentage amount.
Position Sizing
Traders also use ATR to size positions so that a similar dollar amount is risked on each trade regardless of how volatile the underlying asset is, reducing the risk of oversized losses in highly volatile instruments.
ATR vs Standard Deviation
Both are common volatility measures, but they are built differently and are used for different purposes.
| Aspect | ATR | Standard Deviation |
|---|---|---|
| Captures gaps | Yes (via true range) | No (uses close-to-close only) |
| Directional bias | None (pure volatility measure) | None, but sensitive to outliers |
| Common use | Stop-loss placement, position sizing | Bollinger Bands, statistical volatility |
| Smoothing method | Wilder’s moving average | Simple or exponential moving average |
Limitations of ATR
ATR does not indicate the direction of price movement, only its magnitude, so it should be paired with trend or momentum indicators when making trading decisions. It is also a lagging measure, reflecting past volatility rather than predicting future volatility spikes.
Frequently Asked Questions
What is True Range and how is it different from the daily range?
True Range accounts for potential price gaps between trading sessions by taking the greatest of the current high minus low, the absolute value of the high minus the previous close, and the absolute value of the low minus the previous close, whereas the simple daily range only looks at the current high minus low.
What period is most commonly used for ATR?
A 14-period ATR, originally proposed by J. Welles Wilder, is the most widely used setting, though shorter periods make ATR more responsive to recent volatility and longer periods smooth it out further.
How do traders use ATR for stop-loss placement?
Many traders set a stop-loss at a multiple of the ATR (for example, 2x ATR) below their entry price for a long position, so that the stop naturally widens during volatile periods and tightens during calm periods.
Does a rising ATR mean the price is going up?
No, ATR only measures the magnitude of price movement, not its direction; a rising ATR simply means the size of price swings is increasing, whether the market is trending up, down, or trading choppily.
Key Takeaways
Average True Range is a straightforward but powerful way to quantify how much an asset’s price typically moves over a given period, without indicating direction. Because it captures gaps as well as intraday swings, it is widely used for setting stop-losses and sizing positions relative to current market volatility. This article is for informational purposes only and does not constitute investment advice.

QuantPro: AI Finds the Trade Before You Do
From AI-powered chart analysis to real-time market intelligence — everything a serious investor needs, in one platform.
- Automated AI chart analysis with precision trend timing
- Bull Radar: real-time visualization of geopolitical & economic shifts
- Live market-moving news and insights, curated for you

Bull Wave / Bear Wave Forecast Model
Engineered to help you read market direction and momentum faster than the crowd.
- Instantly separate bullish momentum from bearish pressure
- Pinpoint high-probability entry zones with confidence
- Chart signals clear enough for beginners, sharp enough for pros

Winning Pattern Detection
Instantly surfaces the high-probability setups that repeat across the charts — a trusted edge for timing your entries and exits.
- Spot momentum building in real time
- Catch trend-reversal points before they break
- Built for active traders who need results, not theory

AI Live Economic Dashboard
AI analyzes real-time market data — turning complex, global investment flows into clear insight in seconds.
- Track global stock markets in real time
- See exactly which assets are strong — and which are fading
- Watch how geopolitical events move the markets
About the Author