What Is the Ichimoku Cloud?
The Ichimoku Cloud, or Ichimoku Kinko Hyo (“one glance equilibrium chart”), is a technical indicator developed by Japanese journalist Goichi Hosoda that combines several moving-average-like lines into a single chart overlay. Unlike simpler indicators that show only trend or momentum, the Ichimoku Cloud is designed to reveal trend direction, momentum, and potential support and resistance levels all at once.
How the Ichimoku Cloud Is Calculated
The Formula
The indicator is built from five components: Tenkan-sen = (9-period high + 9-period low) ÷ 2; Kijun-sen = (26-period high + 26-period low) ÷ 2; Senkou Span A = (Tenkan-sen + Kijun-sen) ÷ 2, plotted 26 periods ahead; Senkou Span B = (52-period high + 52-period low) ÷ 2, also plotted 26 periods ahead; and the Chikou Span, which is simply the current closing price plotted 26 periods in the past.
A Worked Example
Suppose the 9-period high is 112 and the 9-period low is 104, giving a Tenkan-sen of 108. If the 26-period high is 120 and the low is 94, the Kijun-sen is 107. Senkou Span A then becomes (108+107)÷2=107.5. If the 52-period high is 124 and the low is 88, Senkou Span B is 106. The area between Senkou Span A (107.5) and Senkou Span B (106), projected 26 periods forward, forms the cloud (kumo).
How Traders Use the Ichimoku Cloud
Reading the Cloud
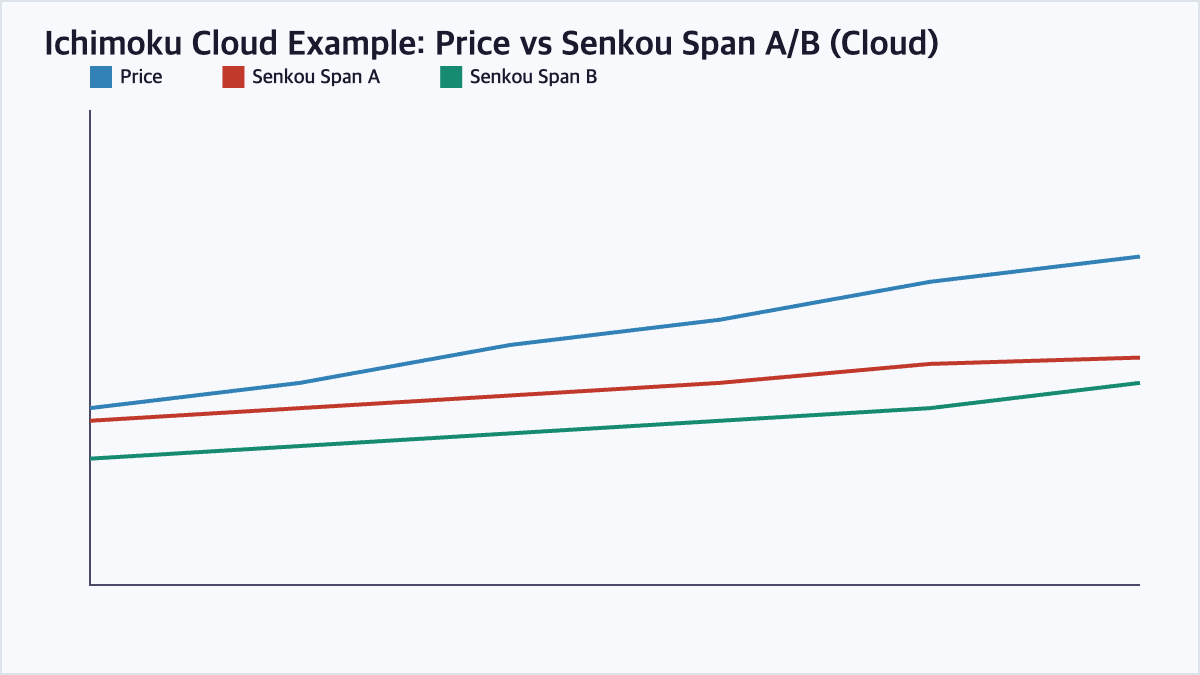
Price trading above the cloud is generally interpreted as a bullish trend, while price below the cloud suggests a bearish trend. Price moving inside the cloud is often read as a sign of consolidation or an unclear trend.
Line Crossovers as Signals
A Tenkan-sen crossing above the Kijun-sen is often treated as a bullish signal, while a cross below is treated as bearish — similar in spirit to a moving average crossover, but combined with the cloud for additional confirmation.
Ichimoku Cloud vs Moving Average Crossover
Both tools help traders read trend direction, but the Ichimoku Cloud packs in considerably more information.
| Aspect | Ichimoku Cloud | Moving Average Crossover |
|---|---|---|
| Components | 5 lines + cloud (kumo) | 2 moving averages |
| Information shown | Trend, momentum, support/resistance at once | Trend direction only |
| Forward-looking | Yes (cloud projected 26 periods ahead) | No |
| Complexity | Higher, more lines to interpret | Simple, easy to read |
Things to Keep in Mind
Because the Ichimoku Cloud packs several lines and a projected cloud into one chart, it can look cluttered to new traders. It tends to work best on higher timeframes and trending markets, and like most technical indicators, it is generally used alongside volume or momentum indicators rather than in isolation.
Frequently Asked Questions
What are the five components of the Ichimoku Cloud?
The five components are the Tenkan-sen (Conversion Line), Kijun-sen (Base Line), Senkou Span A and Senkou Span B (which together form the cloud), and the Chikou Span (Lagging Span).
What does it mean when price is above the cloud?
When price trades above the kumo (cloud), the trend is generally considered bullish, while price trading below the cloud is considered bearish; price inside the cloud suggests a period of consolidation or indecision.
Why is the cloud thickness important?
A thicker cloud represents a wider gap between Senkou Span A and B, which usually indicates stronger potential support or resistance and a period of higher historical volatility, while a thin cloud suggests weaker support/resistance.
What does a Tenkan-sen and Kijun-sen crossover signal?
When the Tenkan-sen crosses above the Kijun-sen, it is often read as a bullish signal similar to a golden cross, while the Tenkan-sen crossing below the Kijun-sen is read as a bearish signal similar to a death cross.
Key Takeaways
The Ichimoku Cloud is a comprehensive indicator that combines trend direction, momentum, and support/resistance levels into a single view, using five lines and a projected cloud to help traders read the market at a glance. Because it packs in more information than simpler indicators, it works best when traders take time to understand each component individually. This article is for informational purposes only and does not constitute investment advice.

QuantPro: AI Finds the Trade Before You Do
From AI-powered chart analysis to real-time market intelligence — everything a serious investor needs, in one platform.
- Automated AI chart analysis with precision trend timing
- Bull Radar: real-time visualization of geopolitical & economic shifts
- Live market-moving news and insights, curated for you

Bull Wave / Bear Wave Forecast Model
Engineered to help you read market direction and momentum faster than the crowd.
- Instantly separate bullish momentum from bearish pressure
- Pinpoint high-probability entry zones with confidence
- Chart signals clear enough for beginners, sharp enough for pros

Winning Pattern Detection
Instantly surfaces the high-probability setups that repeat across the charts — a trusted edge for timing your entries and exits.
- Spot momentum building in real time
- Catch trend-reversal points before they break
- Built for active traders who need results, not theory

AI Live Economic Dashboard
AI analyzes real-time market data — turning complex, global investment flows into clear insight in seconds.
- Track global stock markets in real time
- See exactly which assets are strong — and which are fading
- Watch how geopolitical events move the markets
About the Author