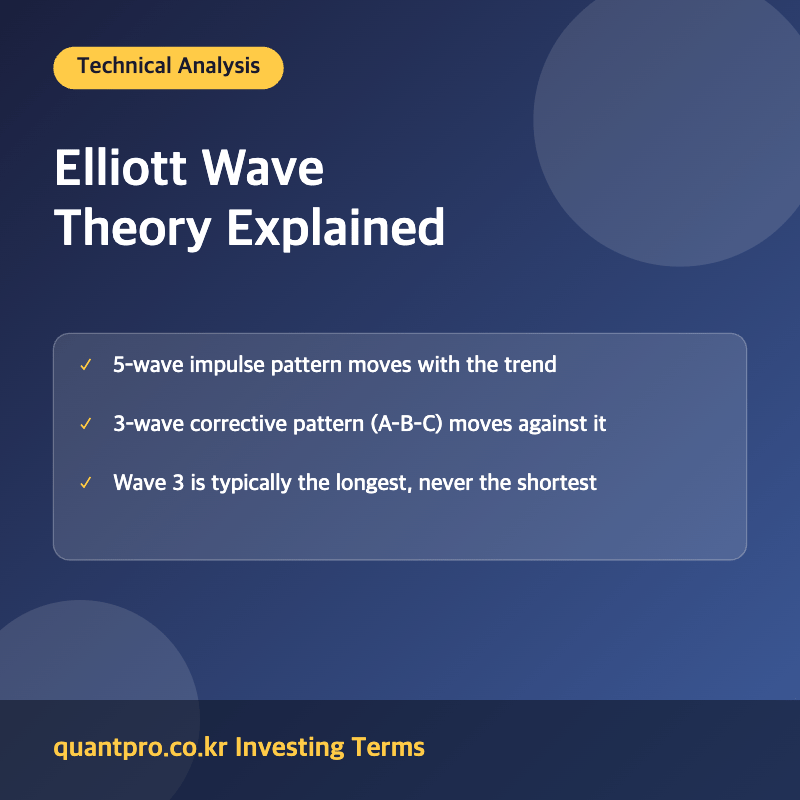
What Is Elliott Wave Theory?
Elliott Wave Theory is a method of technical analysis developed by accountant Ralph Nelson Elliott in the 1930s, based on the idea that financial markets move in repeating, predictable patterns driven by cycles of investor psychology. Elliott observed that price movements tend to unfold in waves rather than in a straight line, and that these waves follow a consistent structural pattern regardless of the specific market or timeframe.
The Structure of Elliott Waves
The Five-Wave Impulse Pattern
According to the theory, a market trend unfolds in five waves in the direction of the larger trend, labeled 1 through 5. Waves 1, 3, and 5 move with the trend, while waves 2 and 4 are smaller counter-trend corrections within the overall move. One key rule is that wave 3 is never the shortest of the three impulse waves (1, 3, and 5), and it is very often the longest.
The Three-Wave Corrective Pattern
After the five-wave impulse completes, the theory holds that the market corrects in three waves, labeled A, B, and C, which move against the direction of the preceding impulse before the next impulse sequence can begin.
A Worked Example
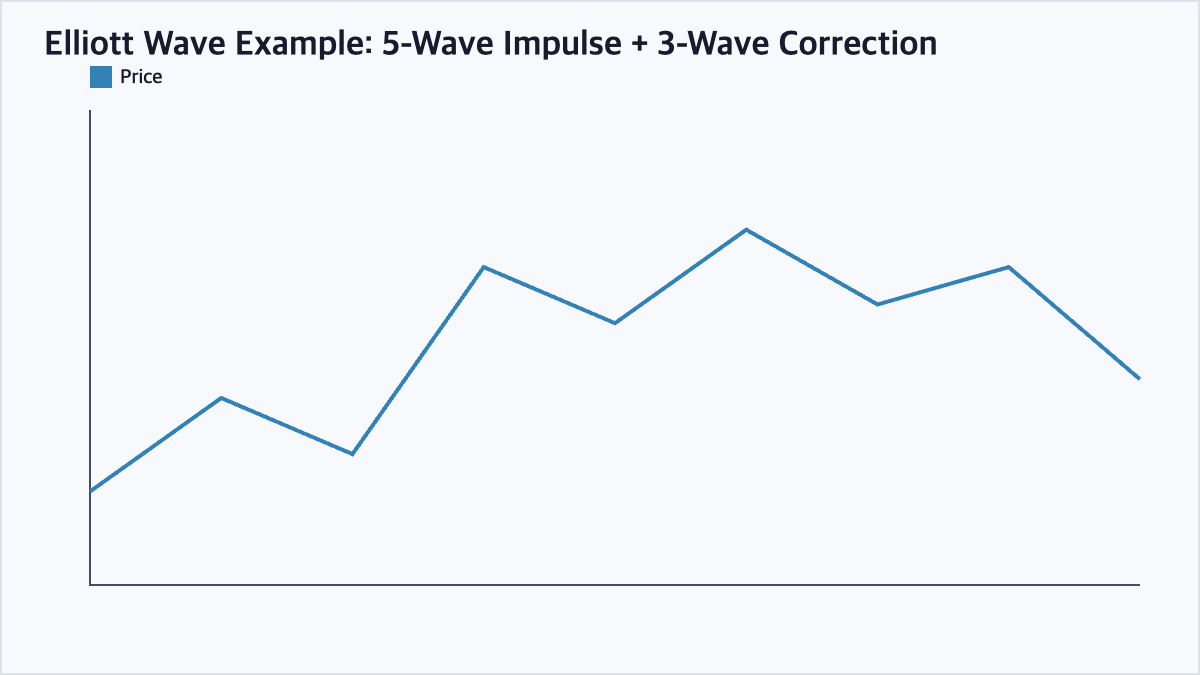
Starting from a price of 100, an impulse sequence might unfold as: wave 1 rises to 110, wave 2 corrects down to 104, wave 3 (the longest wave) rallies to 124, wave 4 pulls back to 118, and wave 5 pushes up to 128. The corrective sequence that follows might then see wave A fall to 120, wave B bounce to 124, and wave C decline to 112.
Impulse Waves vs Corrective Waves
| Aspect | Impulse Waves (1-2-3-4-5) | Corrective Waves (A-B-C) |
|---|---|---|
| Direction | Move with the main trend | Move against the main trend |
| Number of waves | 5 | 3 |
| Typical rule | Wave 3 is never the shortest | Wave B typically retraces part of wave A |
| Fibonacci use | Wave 3 often 1.618x wave 1 | Wave C often equals wave A in length |
Limitations of Elliott Wave Theory
Because identifying where one wave ends and the next begins is subjective, different analysts often produce different wave counts for the same price chart, and it is sometimes possible to reinterpret a wave count after the fact to fit whatever happened. For this reason, Elliott Wave analysis is generally used alongside other technical or fundamental tools rather than as a standalone trading system.
Frequently Asked Questions
What are the two main types of waves in Elliott Wave Theory?
Elliott Wave Theory identifies impulse waves, a five-wave sequence (1-2-3-4-5) that moves in the direction of the larger trend, and corrective waves, a three-wave sequence (A-B-C) that moves against that trend.
Which wave is typically the longest in an impulse sequence?
Wave 3 is most often the longest and strongest of the five impulse waves, and according to Elliott Wave rules, wave 3 can never be the shortest of waves 1, 3, and 5.
How do Fibonacci ratios relate to Elliott Wave Theory?
Many Elliott Wave practitioners use Fibonacci ratios to estimate the likely length of waves and retracements — for example, wave 3 is often projected to be about 1.618 times the length of wave 1, and corrective waves frequently retrace 38.2%, 50%, or 61.8% of the prior impulse move.
What is a common criticism of Elliott Wave Theory?
A common criticism is that wave counts are subjective, since analysts often disagree on where one wave ends and another begins, and it is sometimes possible to fit multiple different wave counts to the same price chart after the fact.
Key Takeaways
Elliott Wave Theory proposes that markets move in a repeating pattern of five impulse waves followed by three corrective waves, reflecting cycles of investor psychology and sentiment. While the underlying pattern rules and Fibonacci relationships offer a structured way to think about market cycles, the subjectivity of counting waves in real time means it works best as one tool among several rather than a standalone trading system. This article is for informational purposes only and does not constitute investment advice.

QuantPro: AI Finds the Trade Before You Do
From AI-powered chart analysis to real-time market intelligence — everything a serious investor needs, in one platform.
- Automated AI chart analysis with precision trend timing
- Bull Radar: real-time visualization of geopolitical & economic shifts
- Live market-moving news and insights, curated for you

Bull Wave / Bear Wave Forecast Model
Engineered to help you read market direction and momentum faster than the crowd.
- Instantly separate bullish momentum from bearish pressure
- Pinpoint high-probability entry zones with confidence
- Chart signals clear enough for beginners, sharp enough for pros

Winning Pattern Detection
Instantly surfaces the high-probability setups that repeat across the charts — a trusted edge for timing your entries and exits.
- Spot momentum building in real time
- Catch trend-reversal points before they break
- Built for active traders who need results, not theory

AI Live Economic Dashboard
AI analyzes real-time market data — turning complex, global investment flows into clear insight in seconds.
- Track global stock markets in real time
- See exactly which assets are strong — and which are fading
- Watch how geopolitical events move the markets
About the Author