Why a Fixed Percentage Stop Falls Short
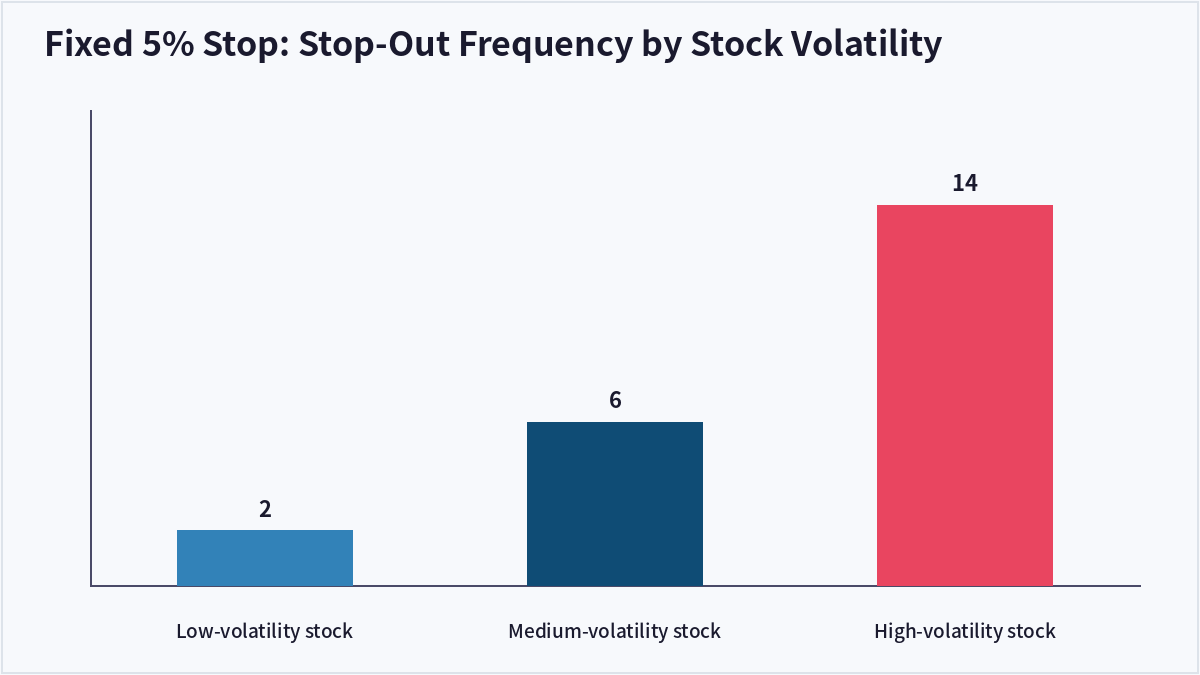
A common approach is setting a stop-loss at a fixed percentage below the entry price, such as 5% or 10%, regardless of the stock. The problem is that stocks differ enormously in their typical daily price swings. A 5% stop on a stock that normally moves 1-2% a day gives ample room, while the same 5% stop on a stock that regularly swings 3-4% a day gets triggered by ordinary noise rather than a genuine trend change.
Using Average True Range (ATR) Instead
Average True Range (ATR) measures a stock’s typical daily trading range over a lookback period, usually 14 days, capturing gaps as well as intraday movement. A common rule of thumb is setting the stop at 2 to 3 times the ATR below the entry price, which automatically widens the stop for volatile stocks and tightens it for calmer ones.
The Worked Example
Suppose a stock is purchased at $50 and its 14-day ATR is $1.50. Using a 2x ATR multiplier, the stop distance is $1.50 × 2 = $3.00, placing the stop at $47.00. If the same investor bought a calmer stock at $50 with an ATR of only $0.50, the 2x stop distance would be just $1.00, placing the stop at $49.00 — a much tighter stop appropriate for that stock’s lower typical volatility.
Tying It to Position Size
Once the stop distance is known in dollar terms, position size can be calculated backward from a fixed risk budget. If an investor is willing to risk $200 on this trade and the stop distance is $3.00 per share, the position size works out to $200 ÷ $3.00 ≈ 66 shares — connecting the volatility-based stop directly to disciplined risk management rather than an arbitrary number of shares.
| Stop Method | Basis | Main Advantage |
|---|---|---|
| Fixed percentage | Entry price × N% | Simple to calculate |
| ATR-based | ATR × 2-3x multiplier | Adapts to each stock’s volatility |
| Support-level based | Recent swing low | Grounded in chart structure |
Frequently Asked Questions
What ATR multiplier should I use?
There’s no universal answer — short-term swing trading often uses 1.5-2x ATR, while longer-term trend-following approaches often use 2.5-3x ATR. Backtesting different multipliers on the specific strategy and timeframe is the only reliable way to find a suitable setting.
Does ATR-based stops eliminate losses?
No — it manages losses to a more consistent, volatility-adjusted range rather than eliminating them. Sharp gap-downs can still exceed the ATR-based stop distance, especially around earnings announcements or other scheduled news events.
How is ATR calculated?
True Range for a given day is the largest of: today’s high minus low, yesterday’s close minus today’s high (absolute value), or yesterday’s close minus today’s low (absolute value). ATR is typically the 14-day moving average of True Range, and most charting platforms calculate it automatically.
Should the stop be recalculated as the trade progresses?
Many traders recalculate ATR periodically and use it as a trailing stop that follows price upward, tightening or widening the stop distance as volatility changes over the life of the trade rather than fixing it only at entry.
Key Takeaways
An ATR-based stop-loss adapts the stop distance to each stock’s actual volatility rather than applying an arbitrary fixed percentage across the board, and tying that stop distance to a fixed dollar risk budget produces a disciplined, repeatable position-sizing process. This article is for informational purposes only and does not constitute investment advice.

QuantPro: AI Finds the Trade Before You Do
From AI-powered chart analysis to real-time market intelligence — everything a serious investor needs, in one platform.
- Automated AI chart analysis with precision trend timing
- Bull Radar: real-time visualization of geopolitical & economic shifts
- Live market-moving news and insights, curated for you

Bull Wave / Bear Wave Forecast Model
Engineered to help you read market direction and momentum faster than the crowd.
- Instantly separate bullish momentum from bearish pressure
- Pinpoint high-probability entry zones with confidence
- Chart signals clear enough for beginners, sharp enough for pros

Winning Pattern Detection
Instantly surfaces the high-probability setups that repeat across the charts — a trusted edge for timing your entries and exits.
- Spot momentum building in real time
- Catch trend-reversal points before they break
- Built for active traders who need results, not theory

AI Live Economic Dashboard
AI analyzes real-time market data — turning complex, global investment flows into clear insight in seconds.
- Track global stock markets in real time
- See exactly which assets are strong — and which are fading
- Watch how geopolitical events move the markets
About the Author