What Is a Candlestick Chart?
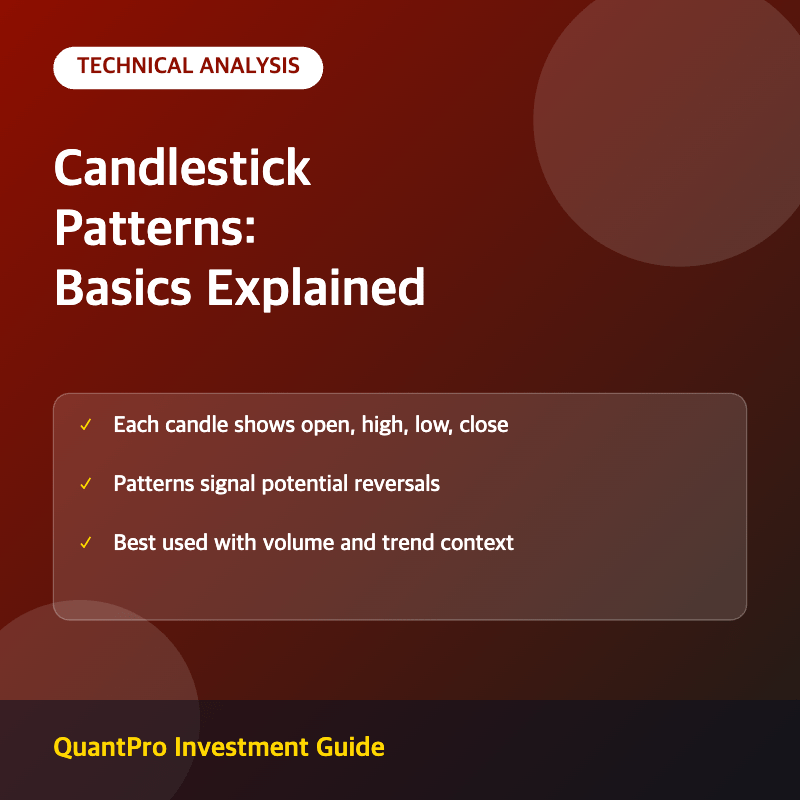
A candlestick chart is a price-charting method that displays four key data points for each trading period: the open, high, low, and close price. Each “candle” consists of a rectangular body showing the range between open and close, plus thin lines called wicks or shadows showing the high and low reached during the period.
A candle is typically colored green or white when the closing price is higher than the opening price (a bullish candle) and red or black when the closing price is lower than the opening price (a bearish candle), giving traders an at-a-glance read on price direction and momentum.
Why Traders Use Candlestick Patterns
Candlestick patterns are recurring shapes formed by one or more candles that traders interpret as signals of potential trend continuation or reversal. These patterns originated in 18th-century Japanese rice trading and remain widely used in modern technical analysis across stocks, forex, and crypto markets.
Common Candlestick Patterns
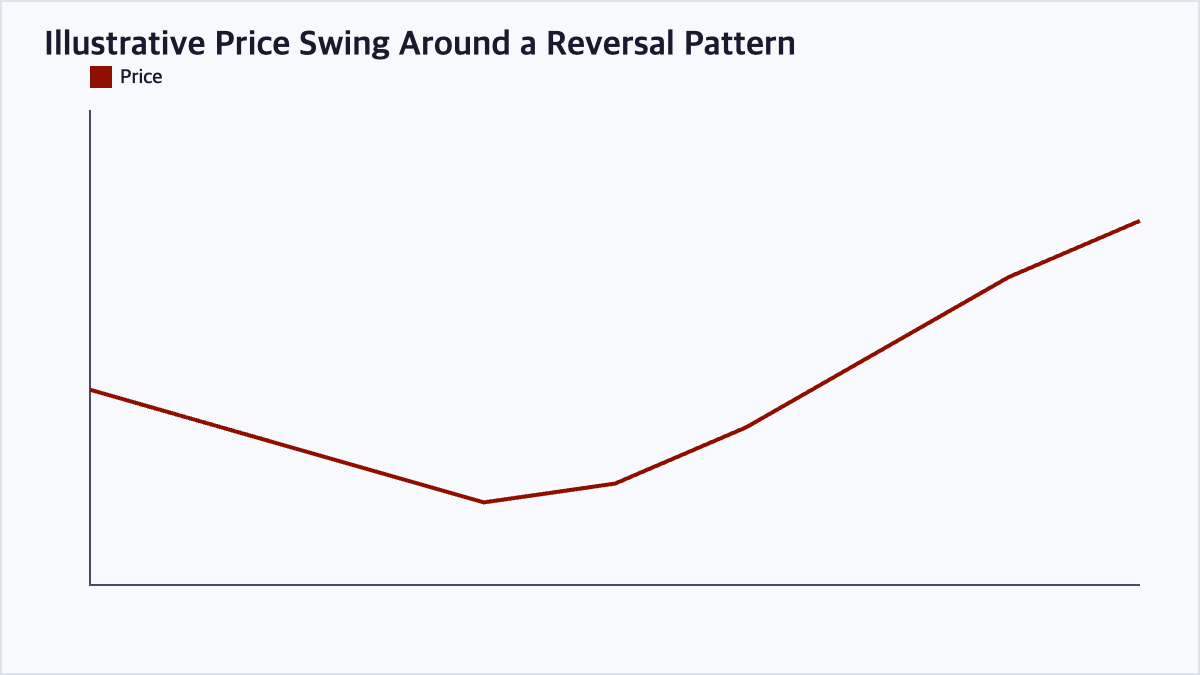
The “hammer” is a single-candle bullish reversal pattern with a small body near the top of the range and a long lower wick, suggesting sellers pushed price down before buyers regained control. The “doji” has a very small or nonexistent body, signaling indecision between buyers and sellers. The “engulfing” pattern occurs when a candle’s body completely covers the prior candle’s body, often signaling a strong reversal in the new direction.
Limitations of Candlestick Patterns
Candlestick patterns are more reliable when confirmed by other factors such as trading volume, support and resistance levels, or broader trend context. Relying on a single pattern in isolation, without confirmation, increases the risk of false signals.
Bullish vs Bearish Candlestick Patterns
| Pattern | Type | What It Suggests |
|---|---|---|
| Hammer | Bullish reversal | Selling pressure exhausted near a low |
| Shooting Star | Bearish reversal | Buying pressure exhausted near a high |
| Bullish Engulfing | Bullish reversal | Buyers overwhelming recent sellers |
| Bearish Engulfing | Bearish reversal | Sellers overwhelming recent buyers |
| Doji | Indecision | Market pause, possible trend change |
Frequently Asked Questions
Are candlestick patterns reliable on their own?
Not typically. Most experienced traders combine candlestick patterns with other technical indicators, such as volume, moving averages, or support and resistance levels, to confirm a signal before acting on it.
What timeframes work best for candlestick pattern analysis?
Candlestick patterns can be applied to any timeframe, from 1-minute intraday charts to weekly or monthly charts, though patterns on longer timeframes generally carry more significance than the same pattern on a very short timeframe.
What is the difference between a doji and a spinning top?
A doji has a very small or nonexistent body where open and close are nearly equal, signaling strong indecision, while a spinning top has a small but visible body with long wicks on both sides, also indicating indecision but with slightly more directional movement during the period.
Can beginners learn candlestick patterns easily?
Yes. While there are dozens of named patterns, beginners typically start by learning a handful of high-frequency, well-documented patterns such as the hammer, doji, and engulfing patterns before expanding to more complex multi-candle formations.
Key Takeaways
Candlestick charts display open, high, low, and close data visually, and specific patterns formed by one or more candles can signal potential trend reversals or continuations. Candlestick analysis is most effective when combined with volume and broader trend confirmation rather than used in isolation. This article is for informational purposes only and does not constitute investment advice.
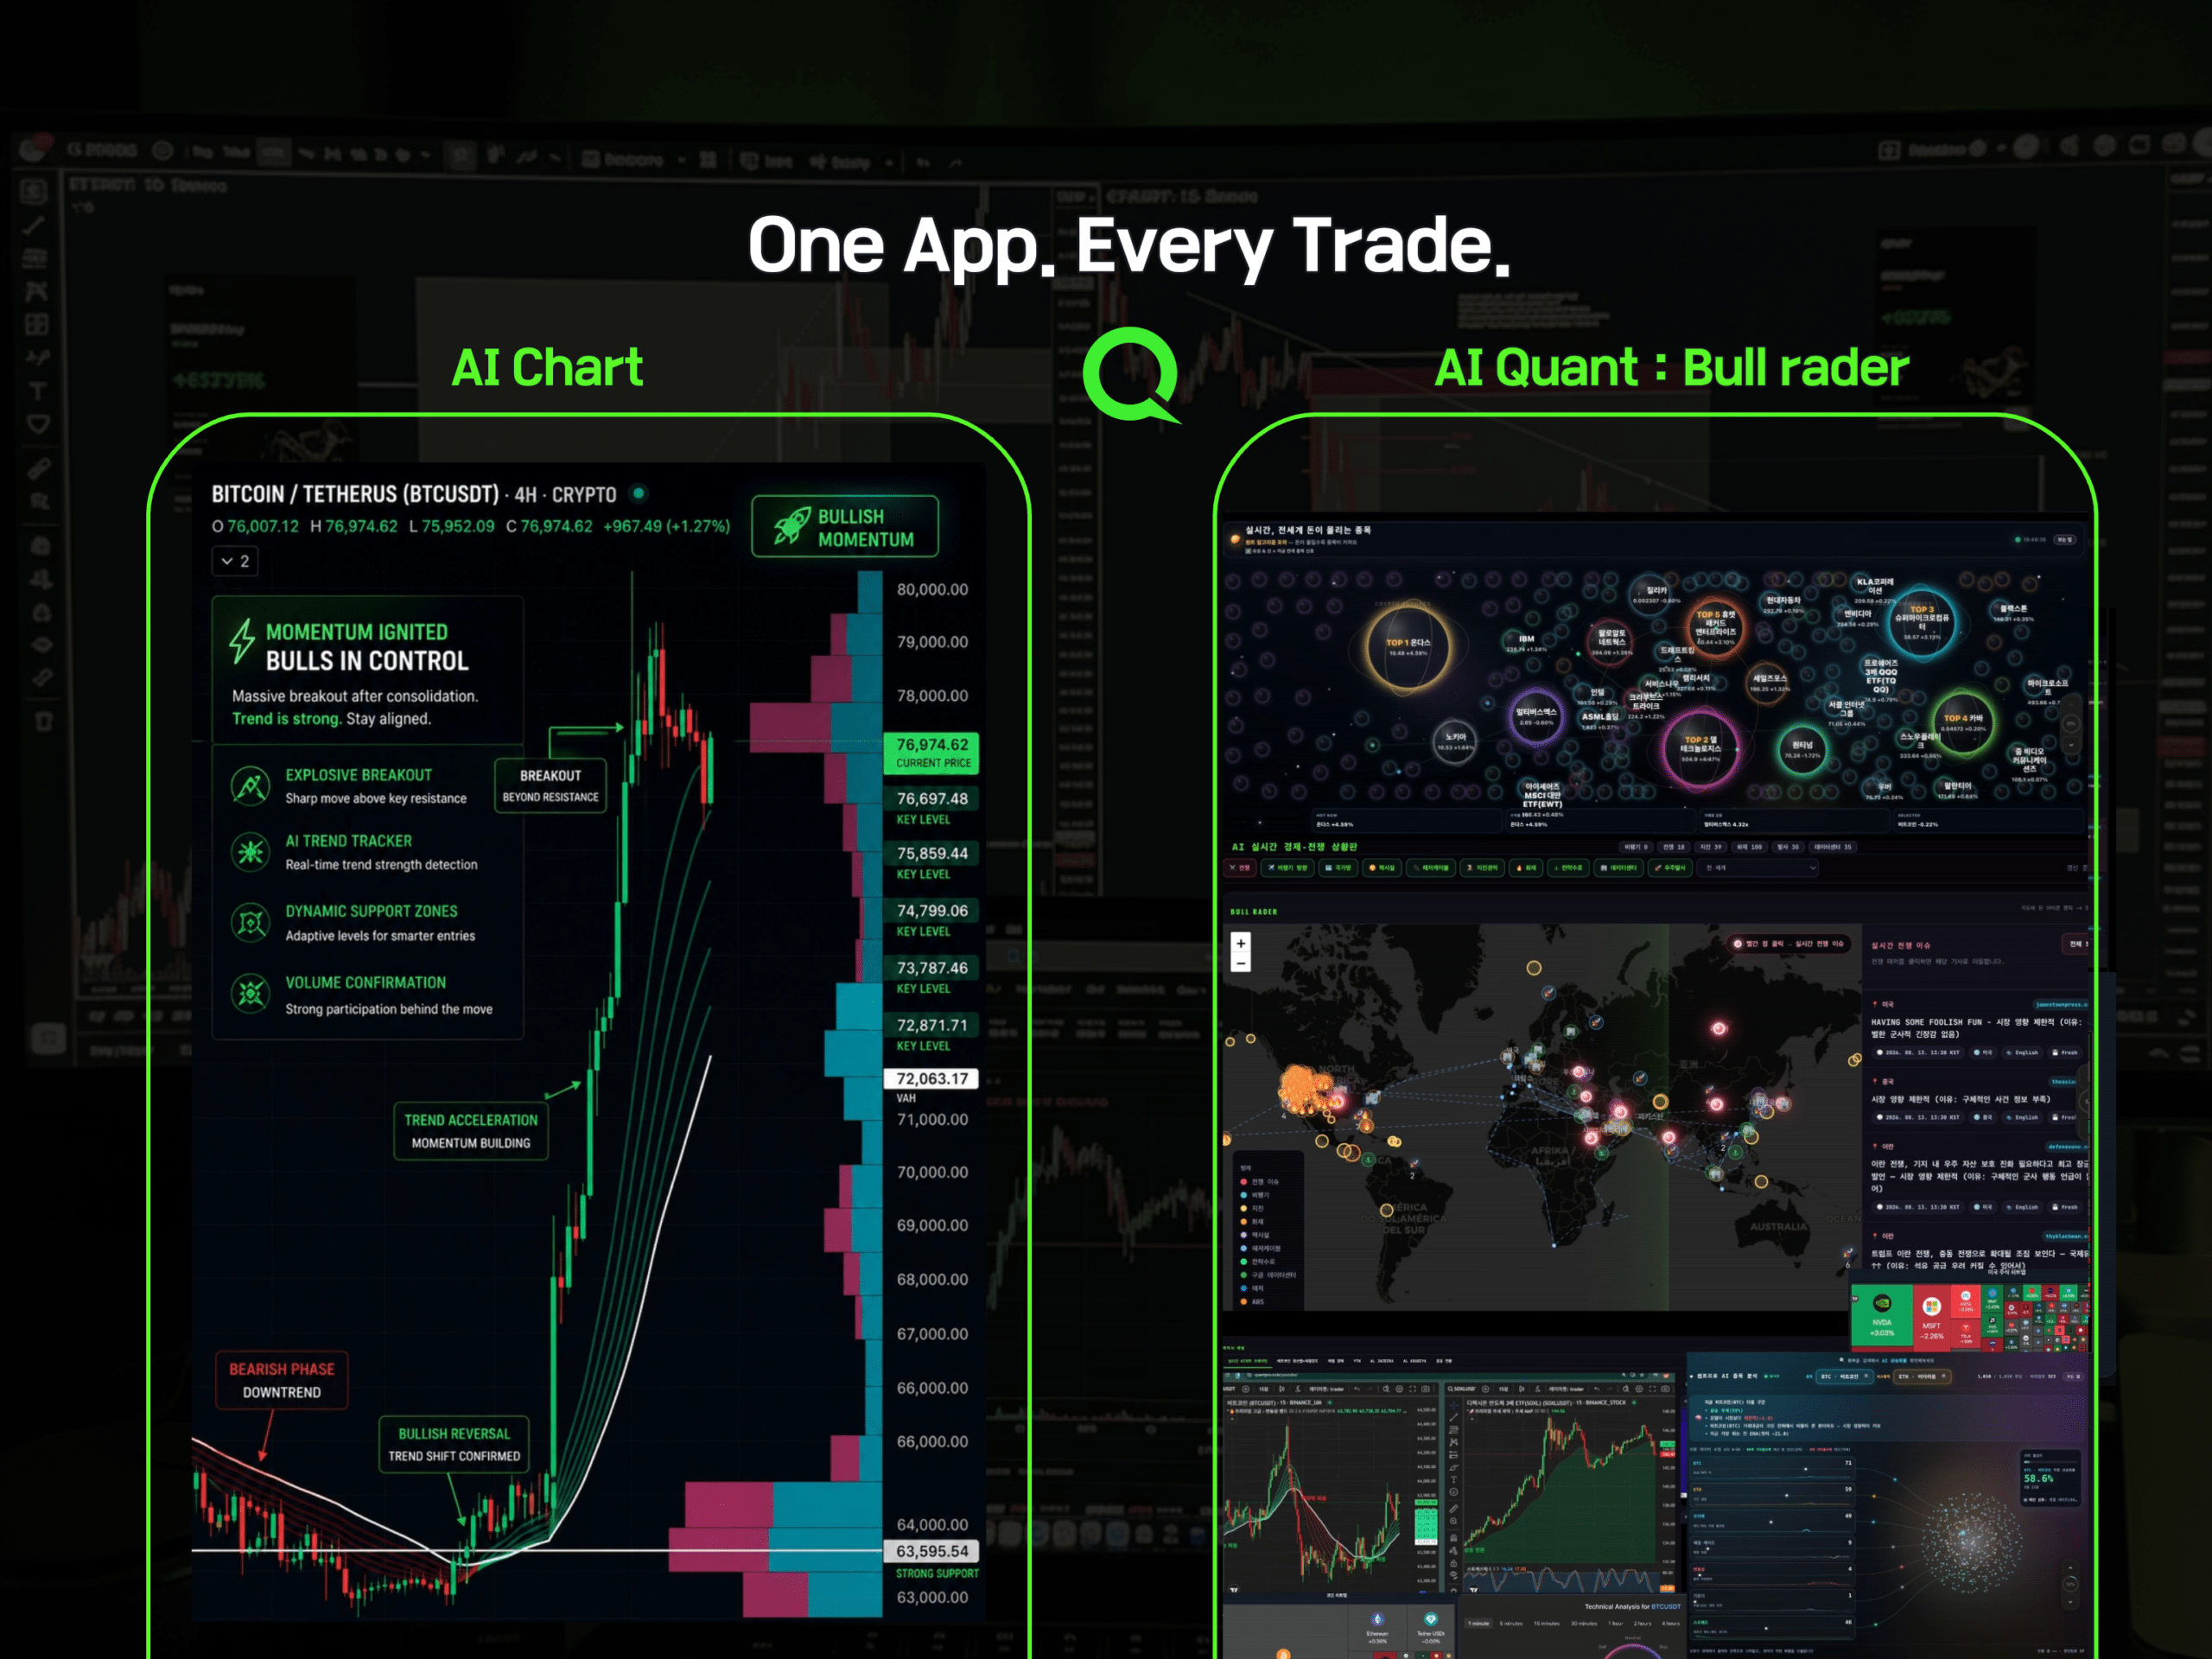
QuantPro: AI Finds the Trade Before You Do
From AI-powered chart analysis to real-time market intelligence — everything a serious investor needs, in one platform.
- Automated AI chart analysis with precision trend timing
- Bull Radar: real-time visualization of geopolitical & economic shifts
- Live market-moving news and insights, curated for you

Bull Wave / Bear Wave Forecast Model
Engineered to help you read market direction and momentum faster than the crowd.
- Instantly separate bullish momentum from bearish pressure
- Pinpoint high-probability entry zones with confidence
- Chart signals clear enough for beginners, sharp enough for pros

Winning Pattern Detection
Instantly surfaces the high-probability setups that repeat across the charts — a trusted edge for timing your entries and exits.
- Spot momentum building in real time
- Catch trend-reversal points before they break
- Built for active traders who need results, not theory

AI Live Economic Dashboard
AI analyzes real-time market data — turning complex, global investment flows into clear insight in seconds.
- Track global stock markets in real time
- See exactly which assets are strong — and which are fading
- Watch how geopolitical events move the markets
About the Author