What Is Trading Volume?
Trading volume is the total number of shares, contracts, or units of a security that change hands during a given period, such as a trading day. Volume is reported alongside price on most charting platforms and serves as a key gauge of market interest and conviction behind a price move.
Analysts use volume to validate price trends: a price move accompanied by high volume is generally considered more significant and likely to continue than the same move on low volume, which may reflect a lack of broad participation.
Volume and Price Confirmation
When price rises alongside increasing volume, it typically signals strong buying conviction and a healthy uptrend. Conversely, when price rises but volume declines, it can indicate weakening momentum and raise the possibility that the trend is running out of steam.
Volume-Based Signals Traders Watch
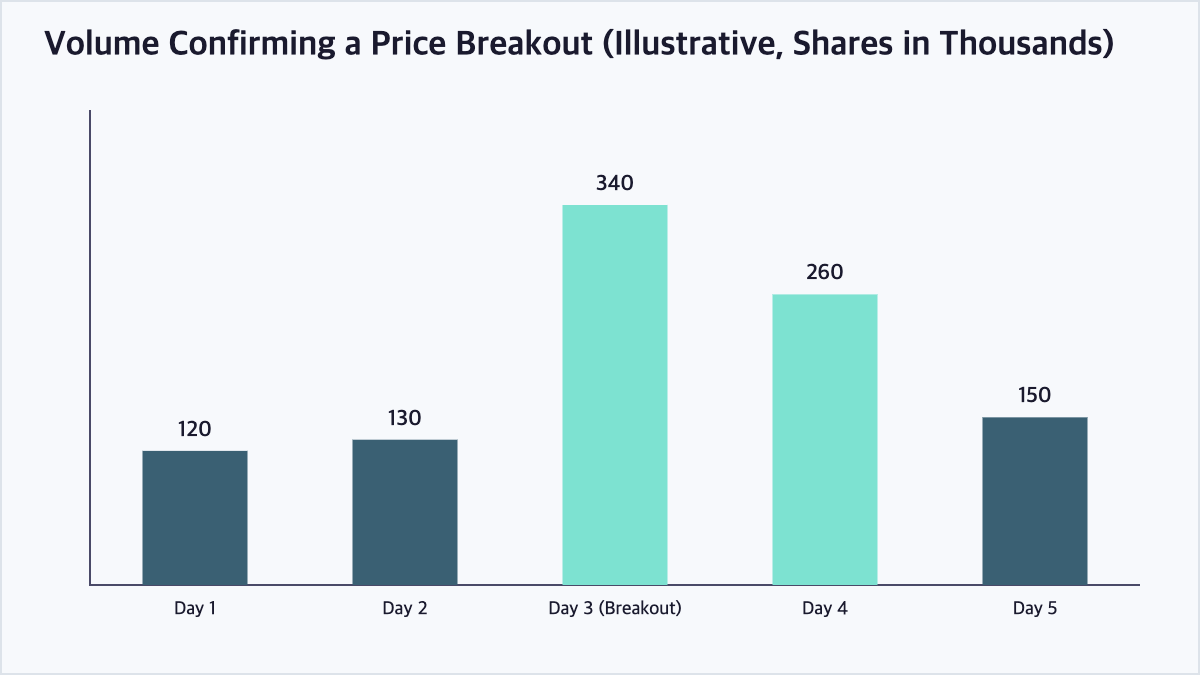
A volume spike, a sudden and significant increase in trading activity, often accompanies major news, earnings releases, or breakouts above key resistance levels, and is used to confirm the validity of the price move. Volume divergence, where price makes a new high or low without a corresponding increase in volume, is often treated as a warning sign of a potential reversal.
On-Balance Volume (OBV)
On-balance volume is a cumulative indicator that adds volume on up days and subtracts volume on down days, creating a running total used to detect whether volume flow supports the current price trend or is diverging from it.
High Volume vs Low Volume: What Each Signals
| Scenario | Interpretation | Trader Takeaway |
|---|---|---|
| Price up, volume up | Strong bullish conviction | Trend likely to continue |
| Price up, volume down | Weakening momentum | Watch for possible reversal |
| Price down, volume up | Strong bearish conviction | Downtrend likely to continue |
| Price down, volume down | Weak selling pressure | Possible trend exhaustion |
| Breakout on high volume | High reliability signal | Higher confidence in the move |
Frequently Asked Questions
Why does volume matter more during a breakout?
A breakout above resistance on high volume suggests broad market participation and conviction, making the move more likely to be sustained, while a breakout on low volume is more prone to failing and reversing back into the prior trading range.
What is considered “average” trading volume?
Average volume is typically measured as the mean number of shares traded over a recent period, such as 20 or 50 trading days, and traders compare current volume against this average to identify unusually high or low activity.
Can volume analysis be used for all asset classes?
Volume analysis is most reliable for centralized, exchange-traded assets like stocks and futures. For decentralized markets such as forex, reported volume reflects only a portion of total activity, making volume analysis somewhat less precise there.
Is high volume always a bullish sign?
No. High volume simply indicates strong interest and can accompany either rising or falling prices; the direction of the price movement, not the volume alone, determines whether the signal is bullish or bearish.
Key Takeaways
Trading volume analysis helps confirm the strength and reliability of price trends, with rising volume generally reinforcing a move and volume divergence often warning of a potential reversal. Combining volume with price action provides a more complete technical picture than price alone. This article is for informational purposes only and does not constitute investment advice.

QuantPro: AI Finds the Trade Before You Do
From AI-powered chart analysis to real-time market intelligence — everything a serious investor needs, in one platform.
- Automated AI chart analysis with precision trend timing
- Bull Radar: real-time visualization of geopolitical & economic shifts
- Live market-moving news and insights, curated for you

Bull Wave / Bear Wave Forecast Model
Engineered to help you read market direction and momentum faster than the crowd.
- Instantly separate bullish momentum from bearish pressure
- Pinpoint high-probability entry zones with confidence
- Chart signals clear enough for beginners, sharp enough for pros

Winning Pattern Detection
Instantly surfaces the high-probability setups that repeat across the charts — a trusted edge for timing your entries and exits.
- Spot momentum building in real time
- Catch trend-reversal points before they break
- Built for active traders who need results, not theory

AI Live Economic Dashboard
AI analyzes real-time market data — turning complex, global investment flows into clear insight in seconds.
- Track global stock markets in real time
- See exactly which assets are strong — and which are fading
- Watch how geopolitical events move the markets
About the Author