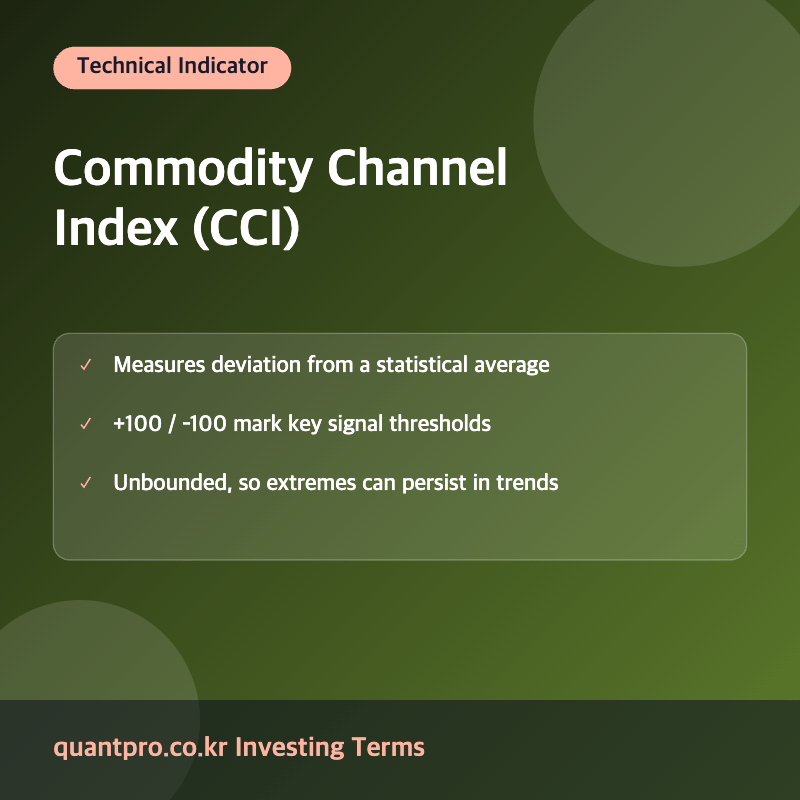
What Is the Commodity Channel Index (CCI)?
The Commodity Channel Index (CCI) is a momentum-based oscillator developed by Donald Lambert in 1980, originally designed to identify cyclical trends in commodity prices but now widely used across stocks, forex, and other markets. CCI measures how far the current price has deviated from its statistical average over a chosen period.
How CCI Is Calculated
The Formula
CCI = (Typical Price − SMA of Typical Price) ÷ (0.015 × Mean Deviation), where Typical Price is calculated as (High + Low + Close) ÷ 3 for each period, and Mean Deviation is the average of the absolute differences between each period’s typical price and the SMA.
A Worked Example
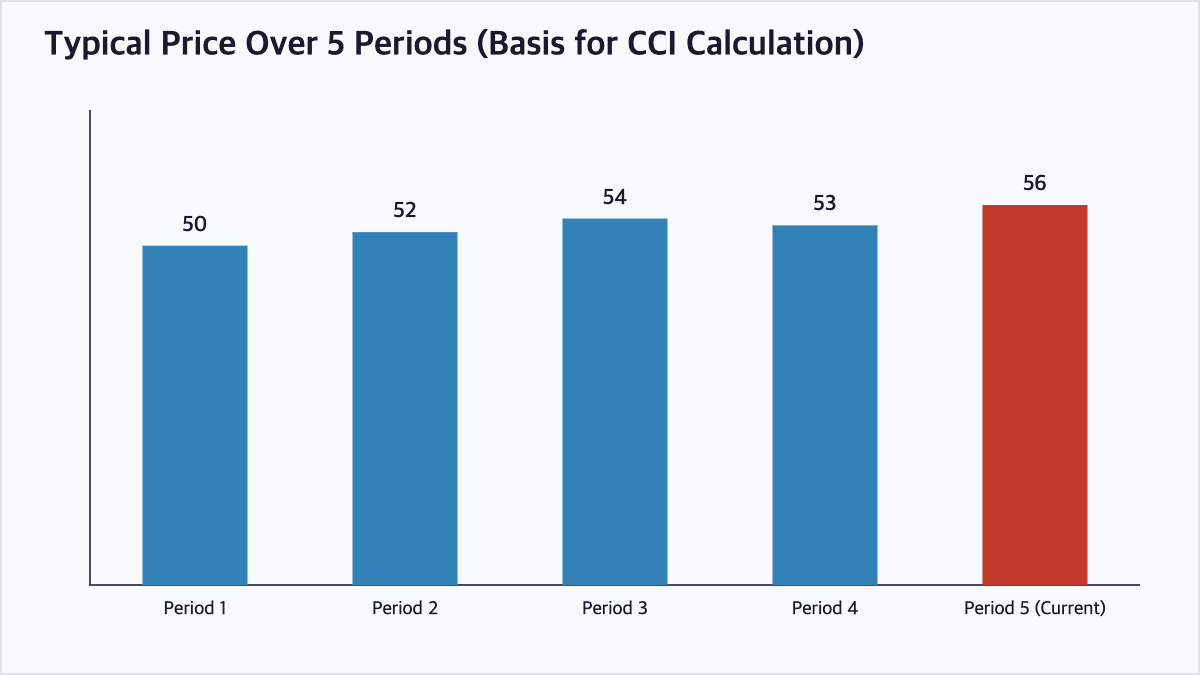
Suppose the typical price over five periods is 50, 52, 54, 53, and 56. The 5-period SMA of these values is (50+52+54+53+56)÷5=53. The mean deviation is the average absolute difference from this SMA: (3+1+1+0+3)÷5=1.6. With the current typical price at 56, CCI = (56−53) ÷ (0.015×1.6) = 3÷0.024 = 125 — a reading well above the +100 threshold.
Reading CCI Signal Levels
Readings above +100 are generally interpreted as a sign of unusually strong upward price movement relative to the recent average, while readings below -100 suggest unusually strong downward movement. Because the underlying price statistics used are only loosely bounded, CCI itself has no fixed upper or lower limit.
CCI vs RSI
| Aspect | CCI | RSI |
|---|---|---|
| Basis | Typical price deviation from its average | Ratio of average gains to average losses |
| Typical range | Unbounded, usually -100 to +100 | Bounded 0 to 100 |
| Overbought/oversold | +100 / -100 | 70 / 30 |
| Common use | Identifying cyclical extremes and new trends | Identifying overbought/oversold momentum |
Limitations of CCI
Because CCI is unbounded, it can remain above +100 or below -100 for extended periods during a strong, sustained trend, which means treating every threshold crossing as an automatic reversal signal can lead to premature exits from a winning trend. Many traders instead use CCI to help confirm the strength of a trend or to spot early momentum shifts, combined with other trend-following tools.
Frequently Asked Questions
What is “typical price” in the CCI formula?
Typical price is calculated as (High + Low + Close) ÷ 3 for each period, and it serves as the basic price input that CCI compares against its moving average.
What does a CCI reading above +100 mean?
A CCI reading above +100 suggests the price is well above its statistical average for the period, often interpreted as the start of a strong uptrend or a potentially overbought condition depending on the broader market context.
What does a CCI reading below -100 mean?
A CCI reading below -100 suggests the price is well below its statistical average for the period, often interpreted as the start of a strong downtrend or a potentially oversold condition.
Why does the CCI formula use the constant 0.015?
Donald Lambert selected the 0.015 constant so that, statistically, roughly 70-80% of CCI values would fall between -100 and +100, making moves beyond that range stand out as comparatively unusual.
Key Takeaways
The Commodity Channel Index measures how far the current price has strayed from its statistical average, using +100 and -100 as key thresholds to flag potentially significant trend moves or overbought/oversold conditions. Because CCI is unbounded, extreme readings can persist during strong trends, so it is often used alongside other trend or volume indicators for confirmation. This article is for informational purposes only and does not constitute investment advice.

QuantPro: AI Finds the Trade Before You Do
From AI-powered chart analysis to real-time market intelligence — everything a serious investor needs, in one platform.
- Automated AI chart analysis with precision trend timing
- Bull Radar: real-time visualization of geopolitical & economic shifts
- Live market-moving news and insights, curated for you

Bull Wave / Bear Wave Forecast Model
Engineered to help you read market direction and momentum faster than the crowd.
- Instantly separate bullish momentum from bearish pressure
- Pinpoint high-probability entry zones with confidence
- Chart signals clear enough for beginners, sharp enough for pros

Winning Pattern Detection
Instantly surfaces the high-probability setups that repeat across the charts — a trusted edge for timing your entries and exits.
- Spot momentum building in real time
- Catch trend-reversal points before they break
- Built for active traders who need results, not theory

AI Live Economic Dashboard
AI analyzes real-time market data — turning complex, global investment flows into clear insight in seconds.
- Track global stock markets in real time
- See exactly which assets are strong — and which are fading
- Watch how geopolitical events move the markets
About the Author