What Is Williams %R?
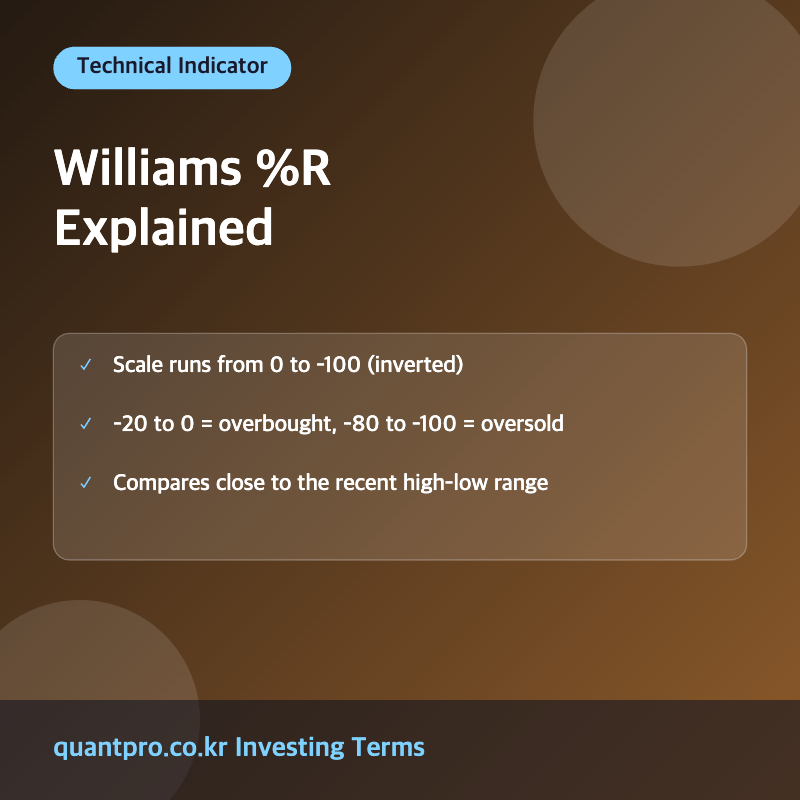
Williams %R is a momentum oscillator developed by trader Larry Williams that measures the level of the current closing price relative to the highest high and lowest low over a specified lookback period, typically 14 periods. Unlike many oscillators that range from 0 to 100, Williams %R uses an inverted scale from 0 to -100.
How Williams %R Is Calculated
The Formula
Williams %R is calculated as: %R = (Highest High − Close) ÷ (Highest High − Lowest Low) × −100, where Highest High and Lowest Low refer to the highest and lowest prices over the chosen lookback period, commonly 14 periods.
A Worked Example
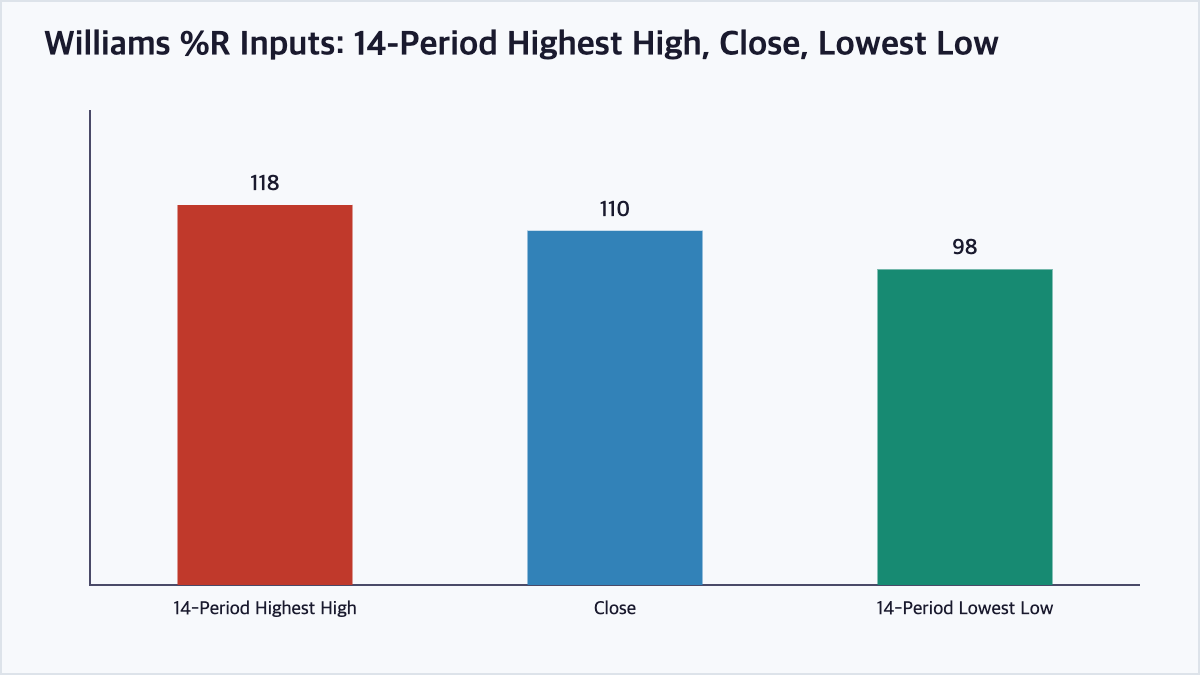
Suppose the 14-period highest high is 118, the 14-period lowest low is 98, and the current close is 110. Plugging these into the formula gives %R = (118−110) ÷ (118−98) × −100 = (8÷20) × −100 = −40, a neutral reading roughly in the middle of the range.
Reading Overbought and Oversold Levels
A reading between -20 and 0 is typically considered overbought, meaning the close is near the top of its recent range, while a reading between -80 and -100 is typically considered oversold, meaning the close is near the bottom of its recent range. Values between -20 and -80 are generally viewed as neutral.
Williams %R vs Stochastic Oscillator
| Aspect | Williams %R | Stochastic Oscillator (%K) |
|---|---|---|
| Scale | 0 to -100 (inverted) | 0 to 100 |
| Overbought level | -20 to 0 | 80 to 100 |
| Oversold level | -100 to -80 | 0 to 20 |
| Smoothing | None (raw calculation) | Often smoothed with a moving average |
Limitations of Williams %R
Because Williams %R is unsmoothed, it can be quite volatile and produce frequent overbought/oversold readings, especially in choppy markets. During strong trends, the indicator can also remain in overbought or oversold territory for extended periods without a reversal actually occurring, so many traders combine it with trend or volume indicators for confirmation.
Frequently Asked Questions
What does a Williams %R reading of -20 or higher mean?
A reading between -20 and 0 is generally considered overbought, suggesting the closing price is trading near the top of its recent range and the asset may be due for a pullback or consolidation.
What does a Williams %R reading of -80 or lower mean?
A reading between -80 and -100 is generally considered oversold, suggesting the closing price is trading near the bottom of its recent range and the asset may be due for a bounce.
How is Williams %R different from the Stochastic Oscillator?
Both indicators compare the closing price to the recent high-low range, but Williams %R uses an inverted scale from 0 to -100 and is typically unsmoothed, while the Stochastic Oscillator uses a 0 to 100 scale and is often smoothed with a moving average.
Can Williams %R give false signals?
Yes, like most oscillators, Williams %R can stay in overbought or oversold territory for extended periods during strong trends, so traders often combine it with trend-confirmation tools rather than trading purely on overbought/oversold signals.
Key Takeaways
Williams %R is a momentum oscillator that measures where the current closing price falls within its recent high-low range, using an inverted 0 to -100 scale to flag potential overbought and oversold conditions. While useful for spotting potential turning points, it works best alongside trend-confirming indicators rather than as a standalone signal. This article is for informational purposes only and does not constitute investment advice.

QuantPro: AI Finds the Trade Before You Do
From AI-powered chart analysis to real-time market intelligence — everything a serious investor needs, in one platform.
- Automated AI chart analysis with precision trend timing
- Bull Radar: real-time visualization of geopolitical & economic shifts
- Live market-moving news and insights, curated for you

Bull Wave / Bear Wave Forecast Model
Engineered to help you read market direction and momentum faster than the crowd.
- Instantly separate bullish momentum from bearish pressure
- Pinpoint high-probability entry zones with confidence
- Chart signals clear enough for beginners, sharp enough for pros

Winning Pattern Detection
Instantly surfaces the high-probability setups that repeat across the charts — a trusted edge for timing your entries and exits.
- Spot momentum building in real time
- Catch trend-reversal points before they break
- Built for active traders who need results, not theory

AI Live Economic Dashboard
AI analyzes real-time market data — turning complex, global investment flows into clear insight in seconds.
- Track global stock markets in real time
- See exactly which assets are strong — and which are fading
- Watch how geopolitical events move the markets
About the Author