What Is Operating Leverage?
Understanding Cost Structures in Business
Operating leverage measures the extent to which a business relies on fixed costs versus variable costs in its operational structure. Fixed costs—such as factory rent, equipment depreciation, and executive salaries—remain constant regardless of production volume. In contrast, variable costs, such as raw materials and direct labor, scale directly with sales volume.
The Magnification Effect on Earnings
When a company has high fixed costs, additional sales do not increase operating expenses proportionally. Once the fixed expenses are covered at the break-even point, a large portion of every additional dollar in revenue flows straight to operating income (EBIT). Consequently, higher operating leverage creates a powerful multiplier effect, causing percentage changes in revenue to result in much larger percentage changes in operating earnings.
How Is Operating Leverage Calculated?
The Degree of Operating Leverage (DOL) Formula
The standard formula for calculating the Degree of Operating Leverage (DOL) measures profit sensitivity to revenue changes: DOL = Percentage Change in EBIT / Percentage Change in Sales. Alternatively, using single-period financial data, DOL = Contribution Margin / Operating Income, where Contribution Margin equals Sales minus Variable Costs, and Operating Income (EBIT) equals Contribution Margin minus Fixed Costs.
Step-by-Step Numerical Example
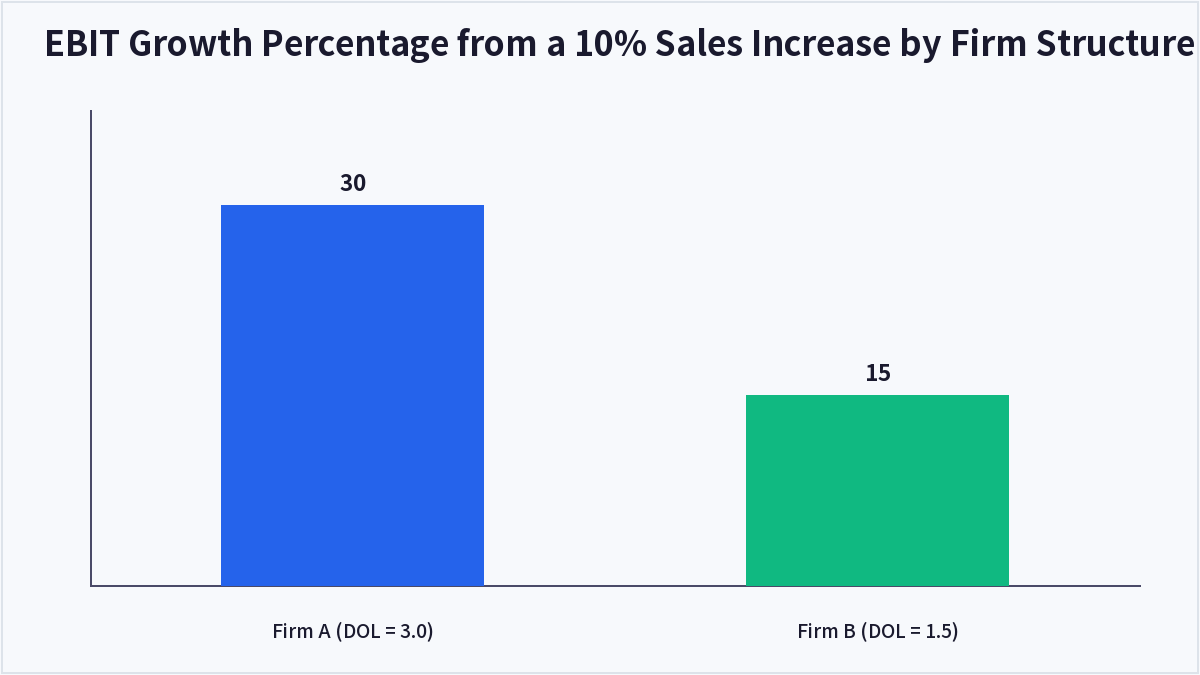
Consider two competing manufacturing firms with $1,000,000 in sales. Firm A operates with high fixed costs of $400,000 and low variable costs of $400,000, generating a contribution margin of $600,000 and an EBIT of $200,000. Its DOL is 3.0 (600,000 / 200,000), meaning a 10% increase in sales yields a 30% increase in EBIT. Firm B relies on low fixed costs of $100,000 and higher variable costs of $700,000, yielding a contribution margin of $300,000 and an EBIT of $200,000. Firm B has a DOL of 1.5 (300,000 / 200,000), meaning a 10% sales growth results in a 15% increase in EBIT.
Why Operating Leverage Matters for Investors
Evaluating Upside Potential and Downside Volatility
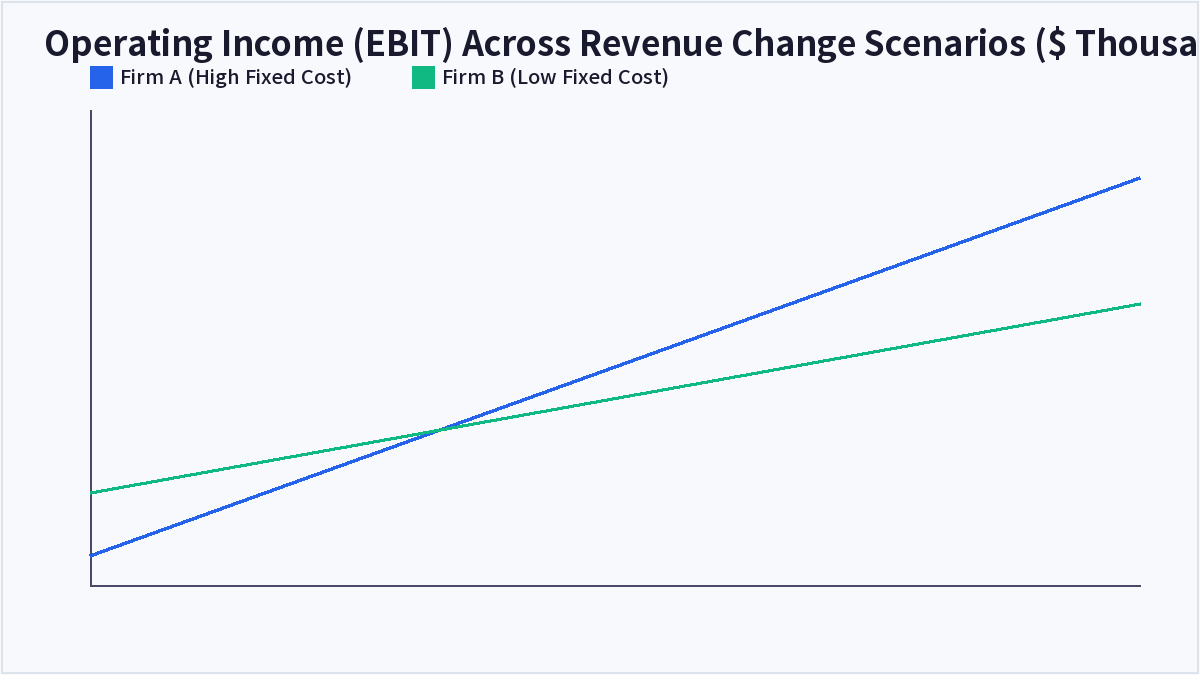
Operating leverage acts as a double-edged sword. During economic expansions, high DOL companies outperform because fixed costs stay flat while revenues grow. For example, when sales increase by 20% to $1,200,000, Firm A sees its EBIT surge to $320,000 (a 60% increase), while Firm B reaches $260,000 (a 30% increase). However, during downturns, high DOL firms suffer severely. If sales drop 10% to $900,000, Firm A’s EBIT drops to $140,000 (a 30% decline), whereas Firm B’s EBIT drops to $170,000 (a 15% decline).
Sector Characteristics and Break-Even Analysis
Capital-intensive industries like software development, telecommunications, and automotive manufacturing naturally exhibit high operating leverage due to large upfront investments. Service-oriented industries, such as consulting or retail trading, maintain lower operating leverage. Investors use DOL to identify cyclically sensitive stocks and assess break-even risk during market contractions.
Operating Leverage vs Financial Leverage
Comparing Cost Sources and Risks
While operating leverage originates from the operational cost structure (fixed operating expenses), financial leverage stems from the capital structure (fixed financing costs like interest on debt). Combining operating leverage and financial leverage determines a company’s total risk exposure, known as Degree of Combined Leverage (DCL). Companies with high operating leverage often prefer low financial leverage to maintain balance sheet stability during industry slowdowns.
| Metric / Feature | High Operating Leverage (Firm A) | Low Operating Leverage (Firm B) |
|---|---|---|
| Primary Cost Structure | High fixed costs, low variable costs | Low fixed costs, high variable costs |
| Industry Examples | Software, Automotive, Airlines | Consulting, Outsourcing, Retail |
| EBIT Sensitivity | High profit fluctuation on sales changes | Moderate profit fluctuation on sales changes |
| Break-Even Volume | Requires higher revenue volume | Requires lower revenue volume |
| Downside Cushion | Lower margin protection during sales dips | Higher margin flexibility during sales dips |
Frequently Asked Questions
What does a high Degree of Operating Leverage indicate?
A high Degree of Operating Leverage (DOL) indicates that a company has a higher proportion of fixed costs relative to variable costs. This means any percentage change in sales will produce a significantly larger percentage change in operating income.
Is a high operating leverage good or bad for investors?
It depends on the economic backdrop. High operating leverage is beneficial during market expansions because it accelerates profit growth. However, it increases investment risk during downturns because earnings fall sharply when sales decline.
How does operating leverage differ from financial leverage?
Operating leverage focuses on fixed operating costs like rent and depreciation, impacting operating income (EBIT). Financial leverage focuses on fixed financing costs like debt interest, impacting net income and earnings per share (EPS).
Can a company lower its operating leverage?
Yes, companies can reduce operating leverage by outsourcing production, renting equipment instead of purchasing, or adopting flexible labor contracts to convert fixed operating costs into variable expenses.
Key Takeaways
Degree of Operating Leverage (DOL) measures how a company’s fixed operating cost structure amplifies changes in revenue into wider fluctuations in operating profit. While high operating leverage drives superior profit expansion during economic growth, it elevates earnings risk during industry contractions. Analyzing DOL alongside financial leverage enables investors to identify cyclical sensitivity and manage downside risk effectively. This article is for informational purposes only and does not constitute investment advice.

QuantPro: AI Finds the Trade Before You Do
From AI-powered chart analysis to real-time market intelligence — everything a serious investor needs, in one platform.
- Automated AI chart analysis with precision trend timing
- Bull Radar: real-time visualization of geopolitical & economic shifts
- Live market-moving news and insights, curated for you

Bull Wave / Bear Wave Forecast Model
Engineered to help you read market direction and momentum faster than the crowd.
- Instantly separate bullish momentum from bearish pressure
- Pinpoint high-probability entry zones with confidence
- Chart signals clear enough for beginners, sharp enough for pros

Winning Pattern Detection
Instantly surfaces the high-probability setups that repeat across the charts — a trusted edge for timing your entries and exits.
- Spot momentum building in real time
- Catch trend-reversal points before they break
- Built for active traders who need results, not theory

AI Live Economic Dashboard
AI analyzes real-time market data — turning complex, global investment flows into clear insight in seconds.
- Track global stock markets in real time
- See exactly which assets are strong — and which are fading
- Watch how geopolitical events move the markets
About the Author