
What Is the Price-to-Sales (P/S) Ratio?
Definition and Core Concept
The Price-to-Sales (P/S) ratio is a key stock valuation metric that compares a company’s market capitalization to its total revenue over a trailing twelve-month period. Unlike net profit valuation metrics such as the Price-to-Earnings (P/E) ratio, the P/S ratio focuses entirely on top-line sales performance.
When Investors Use the P/S Ratio
Investors frequently turn to the P/S ratio when evaluating high-growth tech startups, software-as-a-service firms, or turnaround candidates. Because these companies often reinvest all operating cash back into business expansion, they may generate substantial sales while reporting zero or negative net profit.
How to Calculate the Price-to-Sales Ratio
The P/S Ratio Formula
The Price-to-Sales ratio is calculated by dividing total market capitalization by annual total revenue, or per-share market price by per-share revenue. The mathematical formula is defined as: P/S Ratio = Market Capitalization / Total Annual Revenue.
Numerical Calculation Example
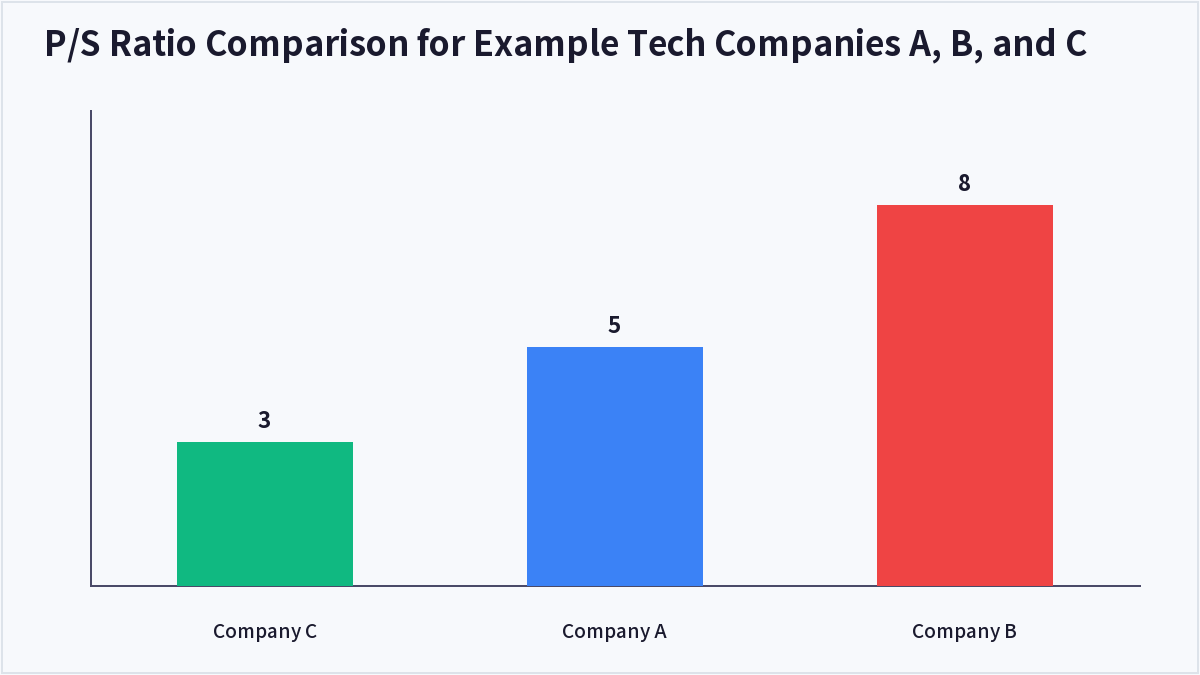
Consider three hypothetical technology firms evaluating their annual performance. Company A maintains a market capitalization of $50 billion against annual revenue of $10 billion, resulting in a P/S ratio of 5.0. Company B holds a market capitalization of $120 billion with $15 billion in annual revenue, giving it a P/S ratio of 8.0. Company C features a market capitalization of $15 billion and revenue of $5 billion, yielding a P/S ratio of 3.0.
Why the Price-to-Sales Ratio Matters for Investors
Evaluating Top-Line Commercial Traction
Because top-line sales figures are far less susceptible to accounting maneuvers, tax adjustments, or non-cash write-offs than net income, the P/S ratio offers a clean reflection of underlying market demand. It provides a stable baseline for valuing young enterprises with erratic bottom-line performance.
Sector Benchmarks and Profit Margin Dynamics
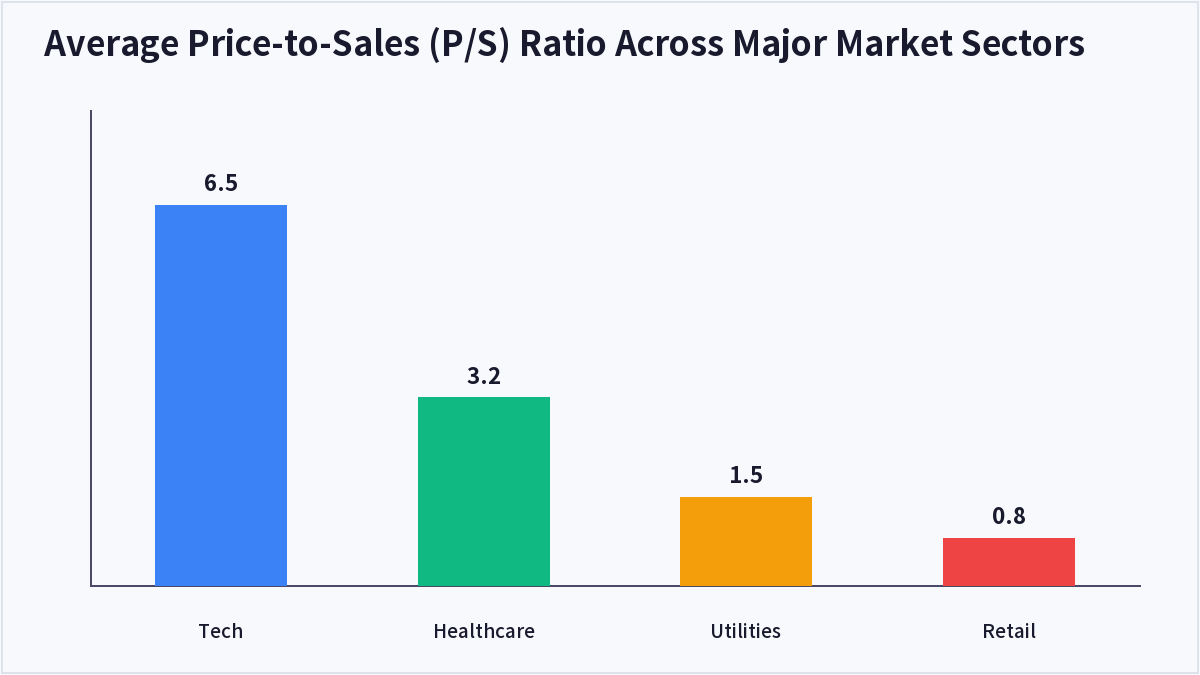
Acceptable P/S ratios vary significantly across market sectors due to differing structural profit margins and business capital intensity. Average sector benchmarks show the Tech sector leading at a P/S of 6.5, Healthcare at 3.2, Utilities at 1.5, and Retail at 0.8.
Price-to-Sales (P/S) Ratio vs P/E Ratio: Key Comparisons
Operational Differences and Profitability Focus
While the P/E ratio measures how much investors pay per dollar of net earnings, the P/S ratio measures how much investors pay per dollar of gross sales revenue. High-margin asset-light software firms can justify high P/S ratios because a substantial fraction of top-line revenue converts directly into free cash flow.
Key Limitations of the P/S Ratio
The primary flaw of relying exclusively on the P/S ratio is that it completely ignores cost structure and capital structure. A company experiencing rapid sales growth but burning capital with high debt obligations can appear undervalued on a P/S basis while standing on fragile financial ground.
| Valuation Metric | Calculation Inputs | Unprofitable Stock Suitability | Debt & Cash Consideration |
|---|---|---|---|
| Price-to-Sales (P/S) | Market Cap / Revenue | High | No |
| Price-to-Earnings (P/E) | Market Cap / Net Income | Low (Undefined) | No |
| Enterprise Value-to-Sales (EV/Sales) | Enterprise Value / Revenue | High | Yes |
| Price-to-Book (P/B) | Market Cap / Book Value | Moderate | Indirect |
Frequently Asked Questions
What is considered a good Price-to-Sales (P/S) ratio?
A P/S ratio below 1.0 or 2.0 is traditionally viewed as attractive, but ideal targets depend heavily on industry benchmarks and gross profit margins.
Can a company have a negative P/S ratio?
No. Unlike net income which can be negative during unprofitable periods, corporate revenue cannot drop below zero, making the P/S ratio always positive.
Why is the P/S ratio useful for fast-growing startups?
Early-stage growth companies often reinvest heavily into research and customer acquisition, showing negative net profit. The P/S ratio lets investors value their growth based on top-line revenue traction.
What is the difference between P/S ratio and EV/Sales ratio?
The P/S ratio uses market capitalization and ignores corporate debt or cash holdings, whereas EV/Sales uses Enterprise Value, accounting for total net debt to reflect true enterprise value.
Key Takeaways
The Price-to-Sales (P/S) ratio is an indispensable tool for valuing early-stage growth companies, unprofitable tech firms, and cyclical businesses. By anchoring valuation to top-line revenue rather than net earnings, it remains resistant to short-term accounting distortion. However, smart investors always evaluate the P/S ratio alongside gross margins and capital structure metrics like EV/Sales to avoid low-margin value traps. This article is for informational purposes only and does not constitute investment advice.

QuantPro: AI Finds the Trade Before You Do
From AI-powered chart analysis to real-time market intelligence — everything a serious investor needs, in one platform.
- Automated AI chart analysis with precision trend timing
- Bull Radar: real-time visualization of geopolitical & economic shifts
- Live market-moving news and insights, curated for you

Bull Wave / Bear Wave Forecast Model
Engineered to help you read market direction and momentum faster than the crowd.
- Instantly separate bullish momentum from bearish pressure
- Pinpoint high-probability entry zones with confidence
- Chart signals clear enough for beginners, sharp enough for pros

Winning Pattern Detection
Instantly surfaces the high-probability setups that repeat across the charts — a trusted edge for timing your entries and exits.
- Spot momentum building in real time
- Catch trend-reversal points before they break
- Built for active traders who need results, not theory

AI Live Economic Dashboard
AI analyzes real-time market data — turning complex, global investment flows into clear insight in seconds.
- Track global stock markets in real time
- See exactly which assets are strong — and which are fading
- Watch how geopolitical events move the markets
About the Author