
What Each Ratio Actually Measures
The price-to-earnings (P/E) ratio divides a company’s share price by its earnings per share, showing how many years of current profit it would take to pay back the purchase price. The price-to-book (P/B) ratio instead divides share price by book value per share, comparing the market price to the accounting value of net assets. P/E is an earnings-based lens; P/B is an asset-based lens, and they often disagree.
When P/E Breaks Down
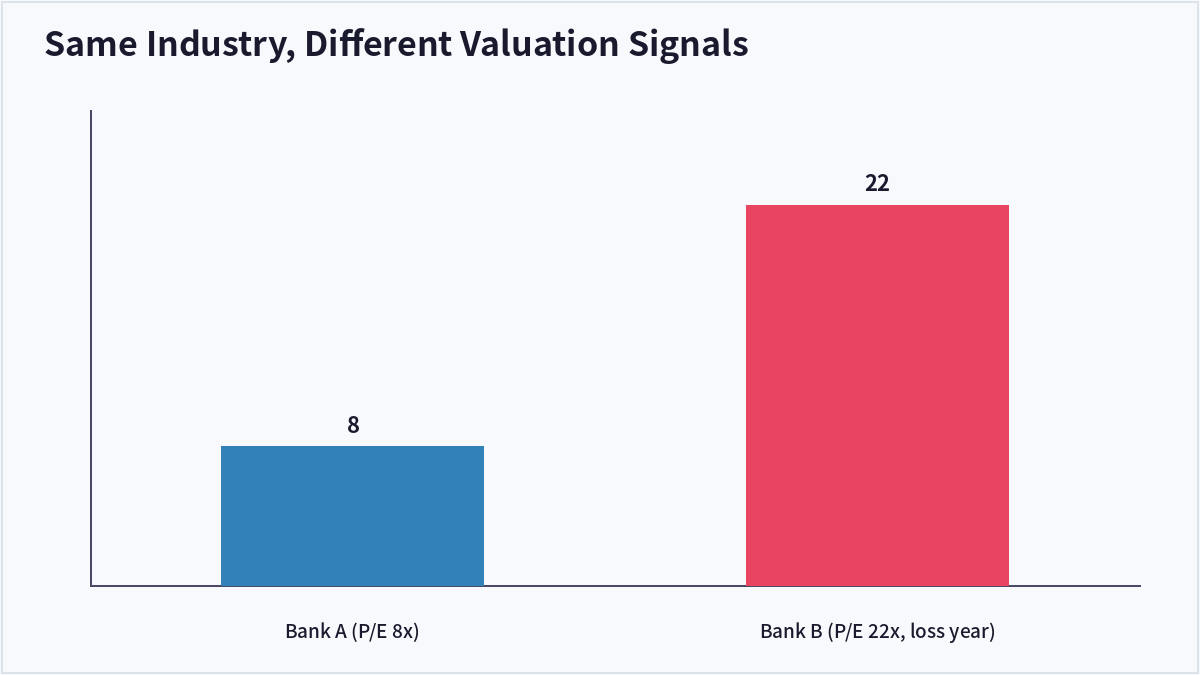
P/E becomes unreliable when earnings are temporarily depressed or inflated by one-off items, when a company is in a loss year (making the ratio negative or meaningless), or when comparing firms with very different depreciation and accounting policies. Cyclical industries like banking, steel, and shipping often show P/E ratios that swing wildly from quarter to quarter for reasons unrelated to the underlying business quality.
Where P/B Fits Better
P/B is especially useful for asset-heavy businesses like banks, insurers, and real estate companies, where book value closely tracks the actual economic assets on the balance sheet. A bank trading below 1x P/B is being valued at less than the accounting value of its loans and securities, which can signal either a genuine bargain or embedded credit risk the market has already priced in.
Using Both Together
Neither ratio alone tells the full story. A stock with a low P/E and a high P/B may be a cyclical business at a temporary earnings peak; a stock with a high P/E and a low P/B may be recovering from a rough patch with assets intact. Comparing both ratios against industry peers, and checking whether return on equity justifies the P/B premium, gives a more complete valuation picture than either metric alone.
| Metric | Best Suited For | Key Weakness |
|---|---|---|
| P/E Ratio | Stable-earnings businesses | Distorted by one-off items, negative in loss years |
| P/B Ratio | Asset-heavy sectors (banks, REITs) | Less useful for asset-light tech/service firms |
| P/E + P/B combined | Cross-checking valuation signals | Requires industry-specific interpretation |
Frequently Asked Questions
Is a low P/B ratio always a bargain?
Not necessarily. A P/B below 1 can mean the market expects future losses that will erode book value, or that the assets are worth less than stated on the balance sheet. It’s worth checking why the market is discounting book value before assuming it’s cheap.
Why do tech companies usually have high P/B ratios?
Asset-light businesses like software companies carry few physical assets on their balance sheets, so book value is naturally small relative to market value, which is driven mostly by intangible assets like brand, IP, and growth expectations that don’t appear on the balance sheet.
Which ratio matters more for value investing?
Classic value investing, as practiced by Benjamin Graham, leaned heavily on P/B as a margin-of-safety measure. Modern value approaches tend to weigh both P/E and P/B alongside cash flow metrics, since book value alone can miss intangible competitive advantages.
Can P/E and P/B be compared across industries?
Generally no. Each industry has a different typical range for both ratios based on its capital structure and growth profile, so comparisons are most meaningful within the same sector rather than across unrelated industries.
Key Takeaways
P/E and P/B measure different things — earnings power versus asset value — and each has blind spots the other can help cover, so comparing both against industry peers gives a more reliable valuation read than relying on either ratio alone. This article is for informational purposes only and does not constitute investment advice.

QuantPro: AI Finds the Trade Before You Do
From AI-powered chart analysis to real-time market intelligence — everything a serious investor needs, in one platform.
- Automated AI chart analysis with precision trend timing
- Bull Radar: real-time visualization of geopolitical & economic shifts
- Live market-moving news and insights, curated for you

Bull Wave / Bear Wave Forecast Model
Engineered to help you read market direction and momentum faster than the crowd.
- Instantly separate bullish momentum from bearish pressure
- Pinpoint high-probability entry zones with confidence
- Chart signals clear enough for beginners, sharp enough for pros

Winning Pattern Detection
Instantly surfaces the high-probability setups that repeat across the charts — a trusted edge for timing your entries and exits.
- Spot momentum building in real time
- Catch trend-reversal points before they break
- Built for active traders who need results, not theory

AI Live Economic Dashboard
AI analyzes real-time market data — turning complex, global investment flows into clear insight in seconds.
- Track global stock markets in real time
- See exactly which assets are strong — and which are fading
- Watch how geopolitical events move the markets
About the Author