What Is the Relative Strength Index (RSI)?
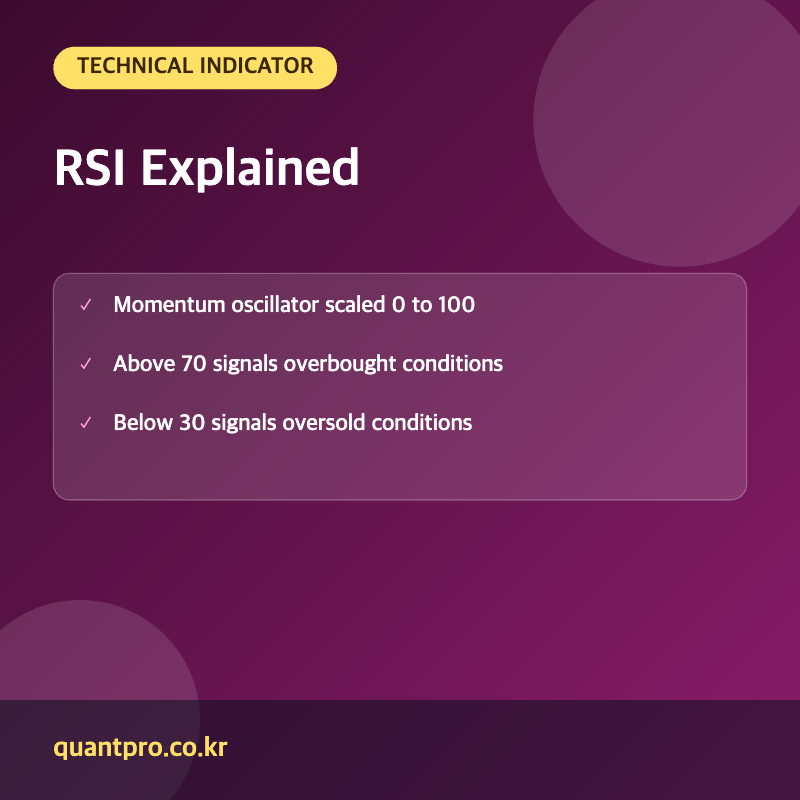
The Relative Strength Index (RSI) is a momentum oscillator that measures the speed and magnitude of a stock’s recent price changes to evaluate whether it is overbought or oversold. Developed by J. Welles Wilder, RSI is calculated using average gains and losses over a typical 14-period lookback window and is expressed on a scale from 0 to 100.
RSI readings above 70 are traditionally interpreted as overbought, suggesting a stock may be due for a pullback, while readings below 30 are considered oversold, suggesting the stock may be due for a bounce — though these thresholds are guidelines rather than guaranteed reversal signals.
How Traders Use RSI
Beyond simple overbought and oversold readings, traders often watch for RSI divergence, which occurs when a stock’s price makes a new high or low that isn’t confirmed by a corresponding new high or low in RSI — a pattern some traders interpret as an early warning sign of weakening momentum and a potential trend reversal.
Limitations of RSI
RSI can remain in overbought or oversold territory for extended periods during strong trending markets, meaning a stock flagged as “overbought” can continue climbing significantly further before any pullback occurs. Because of this, RSI is generally used alongside other indicators and broader trend analysis rather than as a standalone buy or sell signal.
| RSI Reading | Traditional Interpretation | Caveat |
|---|---|---|
| Above 70 | Overbought — possible pullback ahead | Can stay elevated during strong uptrends |
| 30 to 70 | Neutral momentum zone | Most common range during normal trading |
| Below 30 | Oversold — possible bounce ahead | Can stay depressed during strong downtrends |
Frequently Asked Questions
Does an overbought RSI reading mean a stock will definitely fall?
No, an overbought reading simply suggests momentum has been strongly positive recently — during powerful uptrends, RSI can remain above 70 for extended periods without a meaningful price decline.
What time period is typically used to calculate RSI?
A 14-period lookback (often 14 days on a daily chart) is the most common default setting, though traders sometimes adjust this period to make RSI more or less sensitive depending on their trading style.
What is RSI divergence and why does it matter?
RSI divergence occurs when price and RSI move in opposite directions — for example, price makes a higher high while RSI makes a lower high — which some traders view as an early signal that underlying momentum is weakening ahead of a potential trend change.
Should RSI be used alone to make trading decisions?
Most experienced traders avoid relying on RSI in isolation, instead combining it with trend analysis, volume, and other indicators to confirm signals and reduce the risk of false positives during strongly trending markets.
Key Takeaways
The Relative Strength Index measures price momentum on a 0-to-100 scale to flag potential overbought or oversold conditions, but its signals are best confirmed with other indicators since strong trends can keep RSI at extreme levels for extended periods. This article is for informational purposes only and does not constitute investment advice.

QuantPro: AI Finds the Trade Before You Do
From AI-powered chart analysis to real-time market intelligence — everything a serious investor needs, in one platform.
- Automated AI chart analysis with precision trend timing
- Bull Radar: real-time visualization of geopolitical & economic shifts
- Live market-moving news and insights, curated for you

Bull Wave / Bear Wave Forecast Model
Engineered to help you read market direction and momentum faster than the crowd.
- Instantly separate bullish momentum from bearish pressure
- Pinpoint high-probability entry zones with confidence
- Chart signals clear enough for beginners, sharp enough for pros

Winning Pattern Detection
Instantly surfaces the high-probability setups that repeat across the charts — a trusted edge for timing your entries and exits.
- Spot momentum building in real time
- Catch trend-reversal points before they break
- Built for active traders who need results, not theory

AI Live Economic Dashboard
AI analyzes real-time market data — turning complex, global investment flows into clear insight in seconds.
- Track global stock markets in real time
- See exactly which assets are strong — and which are fading
- Watch how geopolitical events move the markets
About the Author