What Are Support and Resistance Levels?
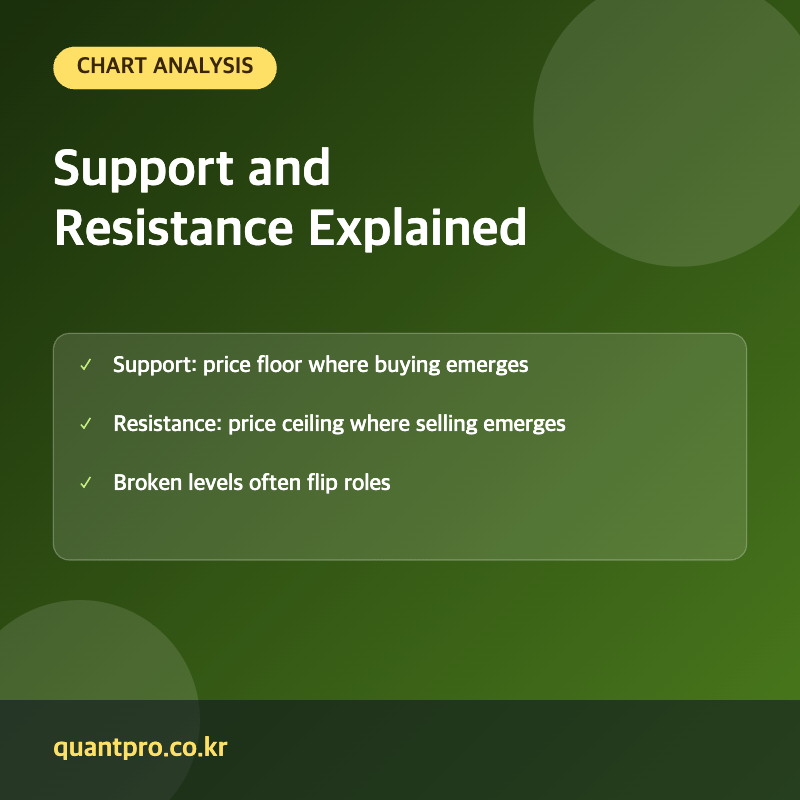
Support and resistance are price levels on a chart where a stock has historically tended to stop and reverse direction, reflecting areas where buying or selling pressure has repeatedly overwhelmed the opposing side. Support refers to a price level where a downtrend has paused due to a concentration of demand, while resistance refers to a price level where an uptrend has paused due to a concentration of supply.
These levels form because market participants remember previous price points where reversals occurred, and many traders place buy or sell orders near these historical levels, which can become somewhat self-fulfilling as a result.
Why Support and Resistance Levels Matter
Traders use support and resistance to identify potential entry and exit points, set stop-loss orders, and gauge the overall strength of a trend. A stock repeatedly failing to break through a resistance level may signal weakening bullish momentum, while a stock repeatedly holding above a support level may signal underlying buying strength.
When Support and Resistance Levels Break
When a stock decisively breaks through a resistance level on strong volume, that former resistance level often becomes a new support level going forward — and the reverse is true when a support level breaks down, as it can then act as resistance on any subsequent rally. This “role reversal” phenomenon is a widely observed pattern in technical analysis.
| Scenario | What It Suggests | Common Trader Response |
|---|---|---|
| Price approaches resistance | Selling pressure may increase | Some traders take profits or watch for a breakout |
| Price approaches support | Buying pressure may increase | Some traders look for a bounce or add to positions |
| Level breaks with strong volume | Old level may flip to the opposite role | Breakout traders may enter in the direction of the break |
Frequently Asked Questions
Are support and resistance levels always exact price points?
No, they are often better thought of as zones rather than precise lines, since price can fluctuate slightly around these levels before a clear reversal or breakout becomes apparent.
Why does a broken resistance level become new support?
Once buyers demonstrate enough strength to push price above a resistance level, that same price zone often becomes a level where buyers step back in on a pullback, reinforcing it as new support going forward.
How reliable are support and resistance levels?
They are not guaranteed to hold — strong fundamental news or shifts in broader market sentiment can cause price to break through historical levels decisively, so they should be used alongside other analysis rather than in isolation.
What increases the significance of a support or resistance level?
A level tested multiple times over a longer time period, or one that coincides with round numbers or other technical indicators like moving averages, is generally considered more significant than a level touched only once.
Key Takeaways
Support and resistance levels mark historical price zones where buying or selling pressure has repeatedly reversed a trend, helping traders identify potential entry, exit, and stop-loss points, though these levels are not guaranteed to hold and work best combined with other analysis. This article is for informational purposes only and does not constitute investment advice.

QuantPro: AI Finds the Trade Before You Do
From AI-powered chart analysis to real-time market intelligence — everything a serious investor needs, in one platform.
- Automated AI chart analysis with precision trend timing
- Bull Radar: real-time visualization of geopolitical & economic shifts
- Live market-moving news and insights, curated for you

Bull Wave / Bear Wave Forecast Model
Engineered to help you read market direction and momentum faster than the crowd.
- Instantly separate bullish momentum from bearish pressure
- Pinpoint high-probability entry zones with confidence
- Chart signals clear enough for beginners, sharp enough for pros

Winning Pattern Detection
Instantly surfaces the high-probability setups that repeat across the charts — a trusted edge for timing your entries and exits.
- Spot momentum building in real time
- Catch trend-reversal points before they break
- Built for active traders who need results, not theory

AI Live Economic Dashboard
AI analyzes real-time market data — turning complex, global investment flows into clear insight in seconds.
- Track global stock markets in real time
- See exactly which assets are strong — and which are fading
- Watch how geopolitical events move the markets
About the Author