What Is Fibonacci Retracement?
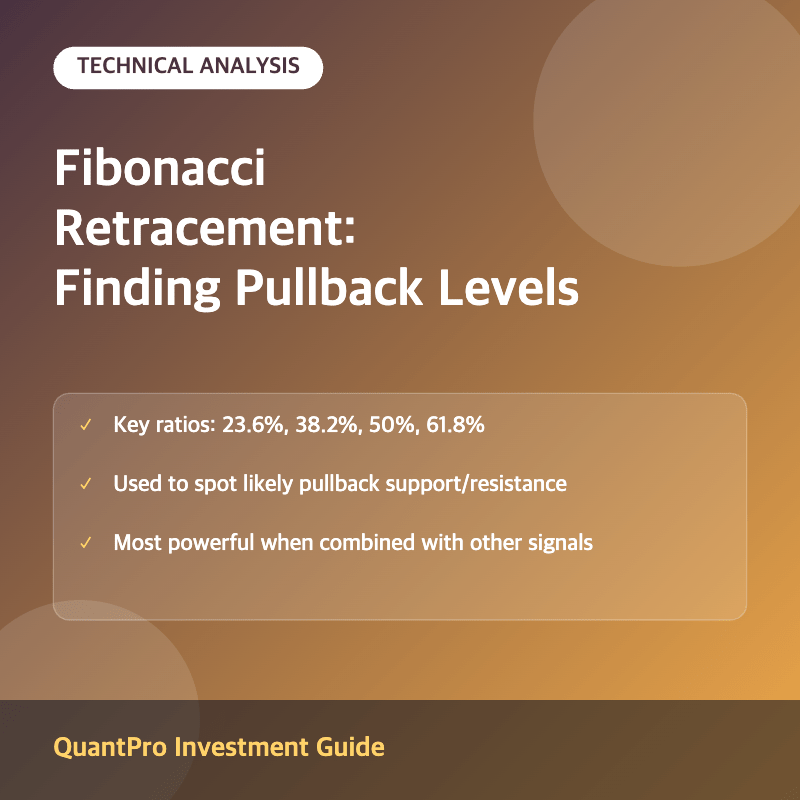
Fibonacci retracement is a technical analysis tool used to identify potential support and resistance levels during a price pullback, based on key ratios derived from the Fibonacci sequence: 23.6%, 38.2%, 50%, 61.8%, and 78.6%. Traders draw these levels between a significant price high and low to forecast where a retracing price move might pause or reverse.
The tool is applied by identifying a clear price swing, either from a low to a high in an uptrend or from a high to a low in a downtrend, and then measuring the retracement levels between those two points using charting software that automatically plots the ratios.
Why the Ratios Matter
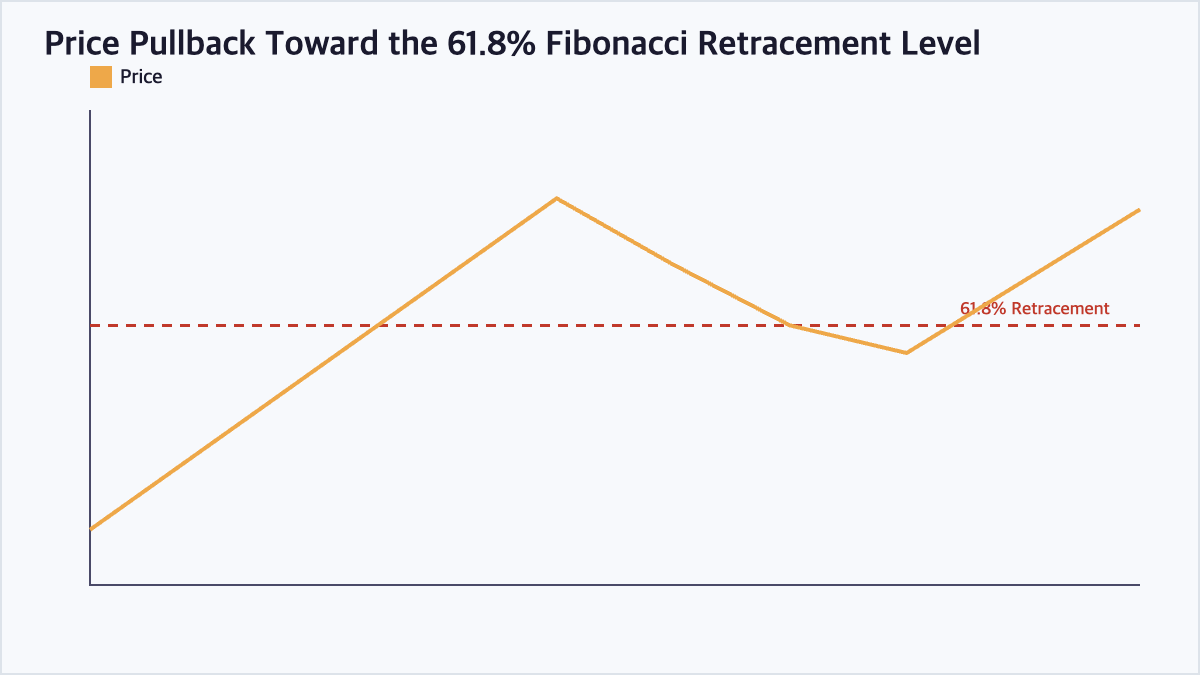
While the 50% level is not technically a Fibonacci ratio, it is commonly included because markets frequently retrace roughly half of a prior move. The 61.8% level, known as the “golden ratio,” is often considered the most significant retracement level, and a pullback that holds above it is frequently viewed as a sign the broader trend remains intact.
How Traders Use Fibonacci Levels
Traders often use Fibonacci retracement levels to identify potential entry points during a pullback within an established trend, aiming to buy near a retracement level in an uptrend or sell near one in a downtrend, rather than chasing the price at new highs or lows.
Combining Fibonacci with Other Tools
Fibonacci retracement levels are most effective when they align with other technical signals, such as a moving average, a prior support or resistance zone, or a bullish candlestick pattern, since this confluence of signals increases confidence that the level will hold.
Common Fibonacci Retracement Levels
| Level | Significance | Trader Interpretation |
|---|---|---|
| 23.6% | Shallow pullback | Strong trend, minor pause |
| 38.2% | Moderate pullback | Healthy correction within trend |
| 50.0% | Psychological midpoint | Common area of consolidation |
| 61.8% | Golden ratio, deep pullback | Key level for trend continuation |
| 78.6% | Very deep pullback | Trend may be at risk of reversing |
Frequently Asked Questions
Is Fibonacci retracement a guaranteed predictor of price reversals?
No. Fibonacci retracement levels identify probable areas where a pullback might pause or reverse based on historical price behavior patterns, but they are not guarantees, and price can break through any level without reversing.
What happens if price breaks below the 78.6% retracement level?
A break below the 78.6% level is often interpreted as a sign that the original trend may be losing strength or reversing entirely, since the pullback has erased nearly all of the prior move.
Can Fibonacci retracement be used on any timeframe?
Yes. Fibonacci retracement can be applied to any chart timeframe, from intraday charts to weekly or monthly charts, though the levels are generally considered more significant on longer timeframes with clearer, more established price swings.
Do all traders draw Fibonacci levels the same way?
Not exactly. Because traders may select slightly different high and low points to anchor the retracement, the exact levels can vary somewhat between analysts, which is why Fibonacci levels are often treated as approximate zones rather than precise prices.
Key Takeaways
Fibonacci retracement uses key ratios to identify likely support and resistance zones during a price pullback, helping traders time entries within an established trend. The tool works best when combined with other technical indicators for confirmation. This article is for informational purposes only and does not constitute investment advice.

QuantPro: AI Finds the Trade Before You Do
From AI-powered chart analysis to real-time market intelligence — everything a serious investor needs, in one platform.
- Automated AI chart analysis with precision trend timing
- Bull Radar: real-time visualization of geopolitical & economic shifts
- Live market-moving news and insights, curated for you

Bull Wave / Bear Wave Forecast Model
Engineered to help you read market direction and momentum faster than the crowd.
- Instantly separate bullish momentum from bearish pressure
- Pinpoint high-probability entry zones with confidence
- Chart signals clear enough for beginners, sharp enough for pros

Winning Pattern Detection
Instantly surfaces the high-probability setups that repeat across the charts — a trusted edge for timing your entries and exits.
- Spot momentum building in real time
- Catch trend-reversal points before they break
- Built for active traders who need results, not theory

AI Live Economic Dashboard
AI analyzes real-time market data — turning complex, global investment flows into clear insight in seconds.
- Track global stock markets in real time
- See exactly which assets are strong — and which are fading
- Watch how geopolitical events move the markets
About the Author