What Is Value at Risk?
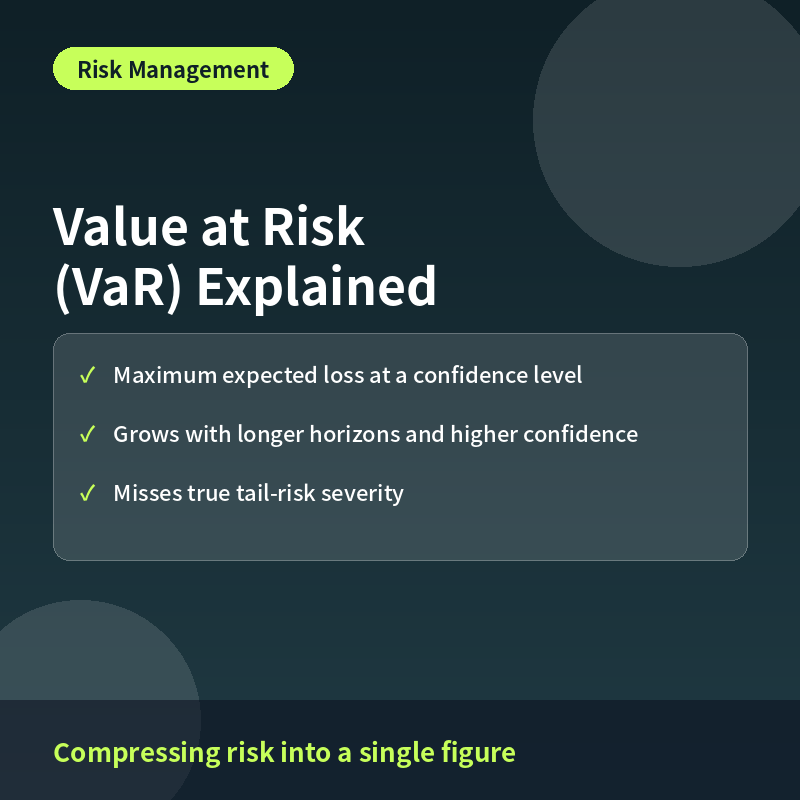
Value at Risk (VaR) estimates the maximum loss a portfolio is expected to suffer over a given time period, at a chosen confidence level, under normal market conditions.
A ‘1-day 95% VaR of $10 million’ means there is only a 5% chance of losing more than $10 million in a single day, based on the model’s assumptions.
How VaR Is Calculated
Common approaches include the historical simulation method, which reuses actual past return distributions, the variance-covariance method, which assumes returns are normally distributed, and Monte Carlo simulation, which generates thousands of hypothetical scenarios.
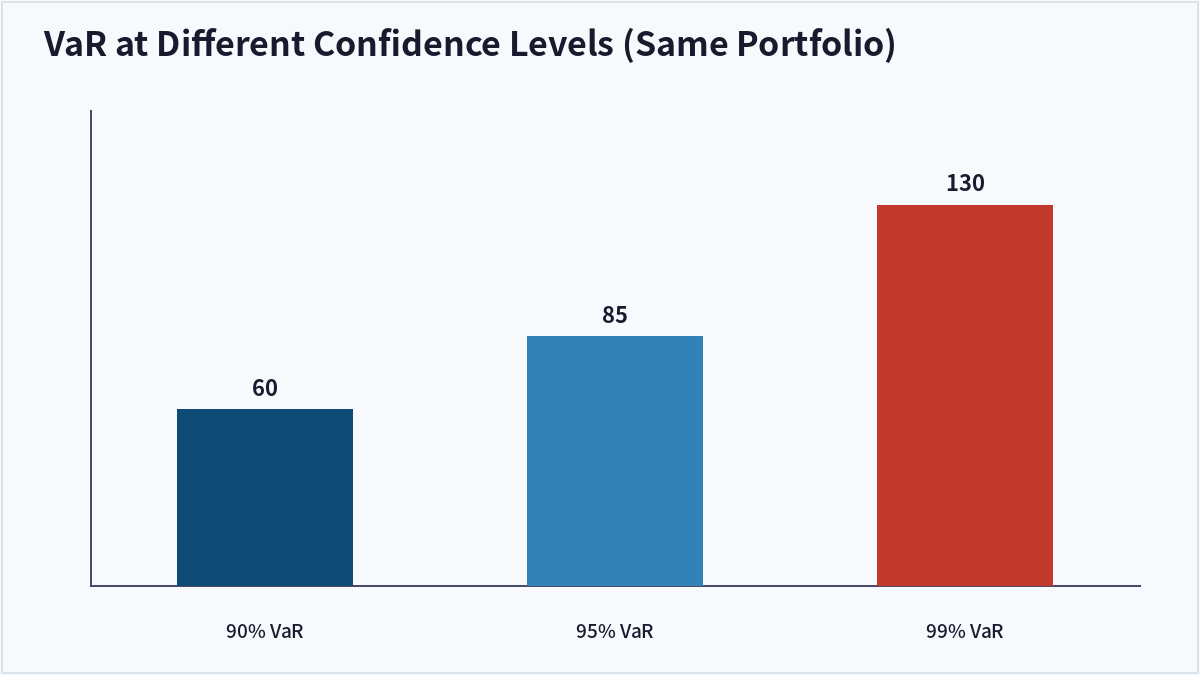
Raising the confidence level from 95% to 99%, or extending the time horizon, both push the estimated VaR figure higher because more extreme outcomes must be covered.
Why It Matters to Investors
Banks, hedge funds, and asset managers widely use VaR to set position limits, allocate regulatory capital, and communicate risk exposure in a single, intuitive number across an organization.
VaR vs. Conditional VaR (CVaR)
VaR has a well-known blind spot once losses cross its threshold, which a related metric attempts to address.
| Aspect | VaR | Conditional VaR (CVaR) |
|---|---|---|
| What it measures | Loss threshold at a given confidence level | Average loss beyond that threshold |
| Tail risk capture | Does not capture severity beyond threshold | Better reflects extreme losses |
| Complexity | Relatively simple | More computationally intensive |
| Common use | Industry-standard risk figure | Used to supplement VaR for tail risk |
Frequently Asked Questions
Does a $10 million VaR mean my maximum loss is $10 million?
No. VaR only describes the loss threshold within the chosen confidence level; losses beyond that threshold, in the remaining tail probability, can be significantly larger.
What is VaR’s biggest weakness?
It is often criticized for underestimating risk during extreme, rare events, since many models assume relatively normal market behavior rather than crisis conditions.
Can individual investors use VaR?
Some brokerage platforms and portfolio analytics tools offer simplified VaR estimates, but it is primarily used by institutional risk managers.
How is VaR different from standard deviation?
Standard deviation measures overall return volatility, while VaR focuses specifically on the potential loss at a defined confidence level, making it a more targeted downside risk measure.
Key Takeaways
VaR condenses complex portfolio risk into one intuitive figure that institutions rely on daily, but its blind spot for extreme tail events means it should be paired with complementary risk measures. This article is for informational purposes only and does not constitute investment advice.

QuantPro: AI Finds the Trade Before You Do
From AI-powered chart analysis to real-time market intelligence — everything a serious investor needs, in one platform.
- Automated AI chart analysis with precision trend timing
- Bull Radar: real-time visualization of geopolitical & economic shifts
- Live market-moving news and insights, curated for you

Bull Wave / Bear Wave Forecast Model
Engineered to help you read market direction and momentum faster than the crowd.
- Instantly separate bullish momentum from bearish pressure
- Pinpoint high-probability entry zones with confidence
- Chart signals clear enough for beginners, sharp enough for pros

Winning Pattern Detection
Instantly surfaces the high-probability setups that repeat across the charts — a trusted edge for timing your entries and exits.
- Spot momentum building in real time
- Catch trend-reversal points before they break
- Built for active traders who need results, not theory

AI Live Economic Dashboard
AI analyzes real-time market data — turning complex, global investment flows into clear insight in seconds.
- Track global stock markets in real time
- See exactly which assets are strong — and which are fading
- Watch how geopolitical events move the markets
About the Author