What Is the Altman Z-Score?
Origin and Purpose
Developed by New York University Professor Edward Altman in 1968, the Altman Z-Score is a quantitative formula designed to predict the likelihood that a company will enter bankruptcy within two years. Instead of relying on a single liquidity or leverage metric, the formula combines five fundamental financial ratios into a unified numerical score.
Core Premise
The model relies on linear discriminant analysis, evaluating multiple financial statistics simultaneously. By looking at liquidity, profitability, leverage, solvency, and operational efficiency together, the Z-Score offers a comprehensive view of corporate financial health.
Altman Z-Score Formula and Calculation
The Original Model Equation
For publicly traded manufacturing companies, the classic Altman Z-Score equation is expressed as: Z = 1.2X1 + 1.4X2 + 3.3X3 + 0.6X4 + 0.999X5. Each coefficient represents the relative statistical weight assigned to that specific financial ratio.
Breaking Down the Five Ratios
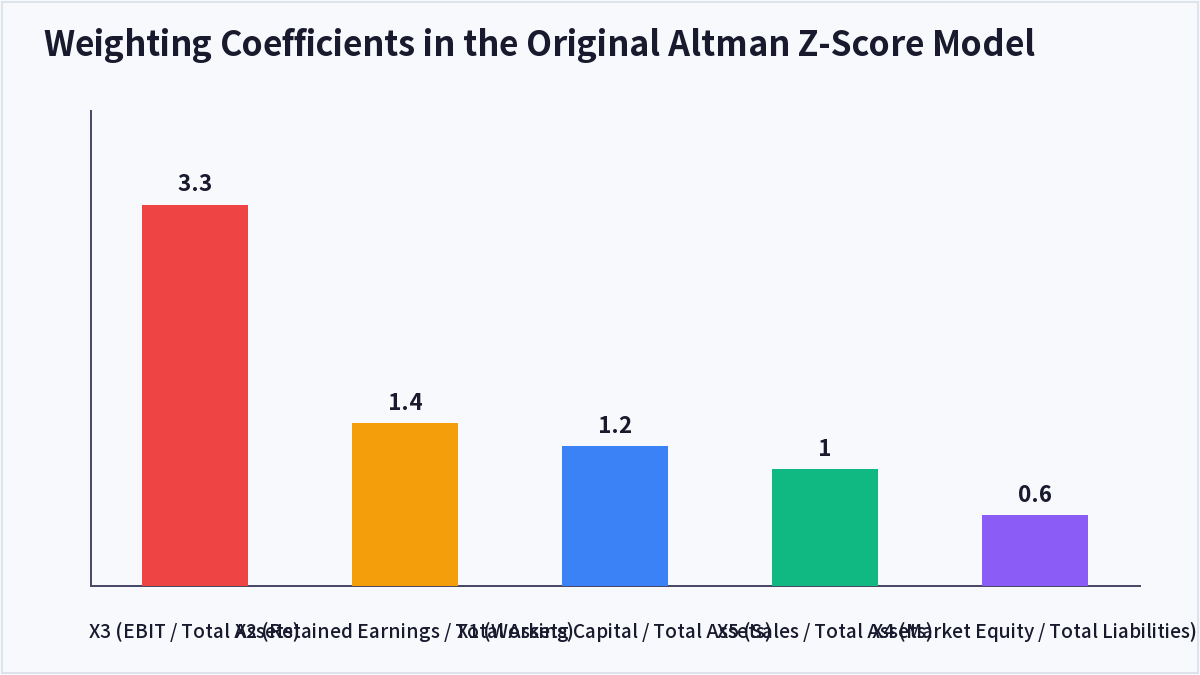
The original Altman Z-Score model assigns specific weights to each ratio: X3 (EBIT / Total Assets) has a weight of 3.3, X2 (Retained Earnings / Total Assets) has a weight of 1.4, X1 (Working Capital / Total Assets) has a weight of 1.2, X5 (Sales / Total Assets) has a weight of 1.0 (rounded from 0.999), and X4 (Market Value of Equity / Total Liabilities) has a weight of 0.6.
Zone Cutoffs for Interpretation
Once calculated, the resulting Z-Score falls into one of three risk zones. A score below 1.81 places the company in the Distress Zone, indicating high insolvency risk. A score between 1.81 and 2.99 represents the Grey Zone, reflecting moderate risk. A score above 2.99 puts the company in the Safe Zone, signifying stable financial health.
Why the Altman Z-Score Matters for Investors
Early Warning Signal
The primary value of the Z-Score is its predictive capability. Studies show the model maintains an accuracy rate of 80% to 90% in identifying impending distress up to two years prior to default, giving investors an early exit opportunity.
Screening for Value Traps
Cheap stocks with low valuation multiples can sometimes be value traps facing severe distress. Applying the Z-Score allows value investors to filter out companies that are distressed from those that are genuinely undervalued.
Altman Z-Score vs. Single Liquidity Ratios
Multivariate Analysis vs. Standalone Metrics
Traditional metrics like the Current Ratio or Debt-to-Equity offer isolated views of short-term liquidity or long-term solvency. The Altman Z-Score combines balance sheet solvency and income statement productivity into one balanced metric, mitigating false positive signals from temporary working capital swings.
| Zone Classification | Z-Score Range | Financial Condition | Default Risk |
|---|---|---|---|
| Distress Zone | Below 1.81 | High Probability of Insolvency | Severe |
| Grey Zone | 1.81 to 2.99 | Moderate / Neutral Health | Moderate |
| Safe Zone | Above 2.99 | Strong Financial Standing | Low |
Frequently Asked Questions
Can the Altman Z-Score be used for financial institutions like banks?
No, the standard model is designed for manufacturing and corporate entities. Banks and financial institutions hold fundamentally different balance sheet structures and require tailored credit models.
What are the Z’-Score and Z”-Score models?
The Z’-Score is a modified model for private manufacturing firms, while the Z”-Score is adapted for non-manufacturing firms and emerging market companies by adjusting ratio factors and weightings.
Is a Z-Score above 3.0 a complete guarantee against bankruptcy?
No score provides a absolute guarantee. Rapid market disruptions, external geopolitical shocks, or accounting fraud can force a firm into restructuring regardless of a historically safe score.
How far in advance can the Altman Z-Score signal distress?
Historically, the model has demonstrated high reliability in detecting financial distress one to two years before formal default or bankruptcy filings occur.
Key Takeaways
The Altman Z-Score is a quantitative multi-factor model that combines five core financial ratios to assess a company’s financial stability and forecast two-year bankruptcy probability. Categorizing firms into Distress (below 1.81), Grey (1.81 to 2.99), and Safe (above 2.99) zones enables quantitative investors and credit analysts to quickly screen out solvency risks and avoid potential value traps. This article is for informational purposes only and does not constitute investment advice.

QuantPro: AI Finds the Trade Before You Do
From AI-powered chart analysis to real-time market intelligence — everything a serious investor needs, in one platform.
- Automated AI chart analysis with precision trend timing
- Bull Radar: real-time visualization of geopolitical & economic shifts
- Live market-moving news and insights, curated for you

Bull Wave / Bear Wave Forecast Model
Engineered to help you read market direction and momentum faster than the crowd.
- Instantly separate bullish momentum from bearish pressure
- Pinpoint high-probability entry zones with confidence
- Chart signals clear enough for beginners, sharp enough for pros

Winning Pattern Detection
Instantly surfaces the high-probability setups that repeat across the charts — a trusted edge for timing your entries and exits.
- Spot momentum building in real time
- Catch trend-reversal points before they break
- Built for active traders who need results, not theory

AI Live Economic Dashboard
AI analyzes real-time market data — turning complex, global investment flows into clear insight in seconds.
- Track global stock markets in real time
- See exactly which assets are strong — and which are fading
- Watch how geopolitical events move the markets
About the Author