What Are Bollinger Bands?
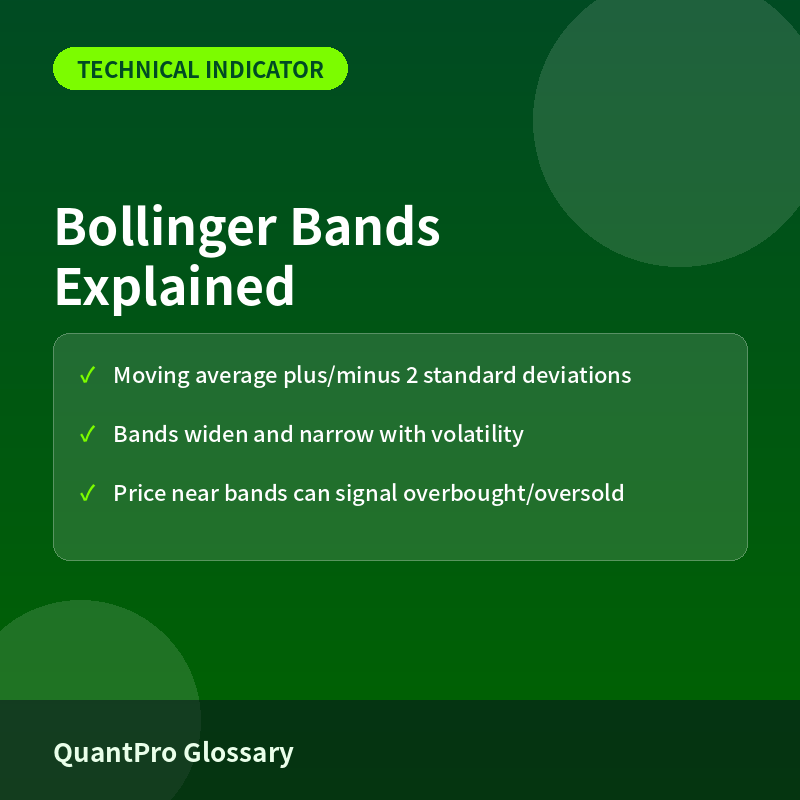
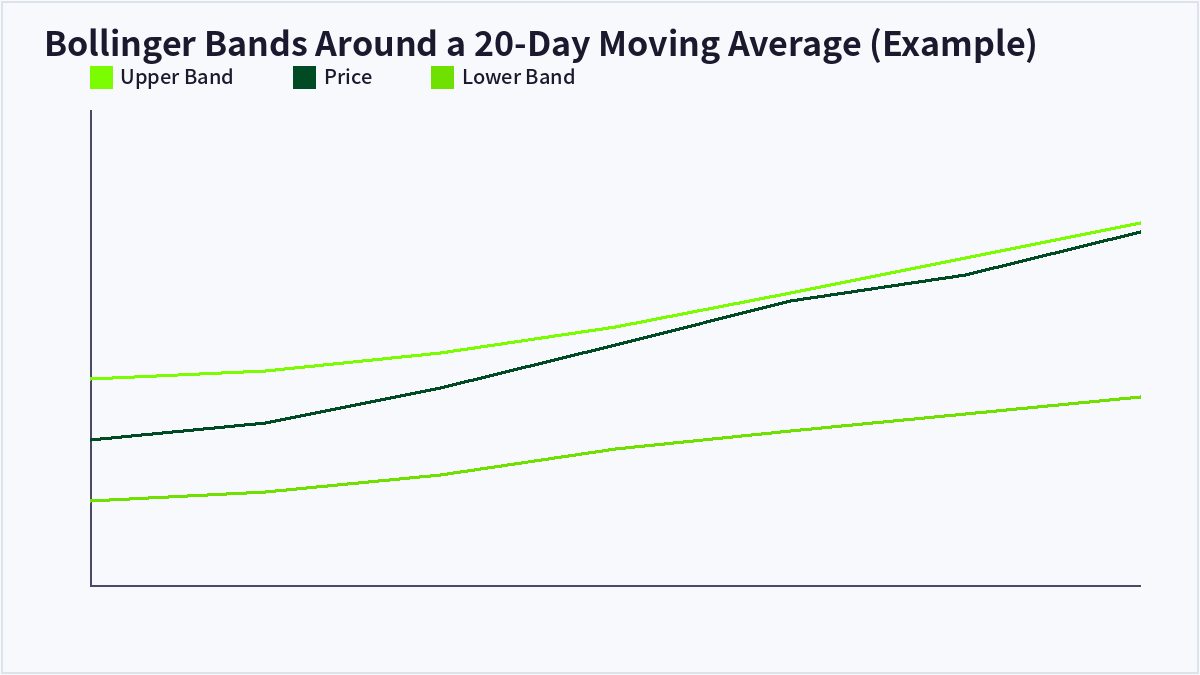
Bollinger Bands are a technical analysis tool consisting of three lines plotted around a price chart: a middle band, which is typically a 20-day simple moving average, and an upper and lower band set a certain number of standard deviations away from that average. The bands expand and contract based on how volatile the price has recently been.
How Bollinger Bands Are Calculated
The Formula
The middle band is the N-period simple moving average (commonly 20 days), while the upper band is the middle band plus 2 standard deviations of price over the same period, and the lower band is the middle band minus 2 standard deviations. Because standard deviation grows and shrinks with actual price volatility, the bands automatically widen during turbulent periods and narrow during calmer ones.
Reading Band Width and Price Touches
When the bands squeeze tightly together, it typically signals a period of low volatility that may precede a sharp breakout in either direction. When price repeatedly touches or pushes beyond the upper band, some traders interpret that as an overbought condition, while repeated touches of the lower band can suggest an oversold condition — though price can also ride along a band during a strong trend.
Why Bollinger Bands Matter
Bollinger Bands give traders a visual, adaptive way to gauge whether current price action is unusually stretched relative to its own recent volatility, rather than relying on a fixed threshold. They’re widely used alongside momentum indicators like RSI to help confirm potential reversal or breakout signals, since a band touch alone doesn’t guarantee a price reversal is imminent.
Band Squeeze vs Band Expansion
The table below compares what a tight squeeze versus a wide expansion in the bands typically signals.
| Aspect | Band Squeeze (Narrow) | Band Expansion (Wide) |
|---|---|---|
| Volatility level | Low | High |
| Typical setup | Possible breakout ahead | Trend already underway |
| Trading approach | Watch for breakout direction | Watch for trend exhaustion |
Frequently Asked Questions
Does touching the upper Bollinger Band mean it’s time to sell?
Not automatically. In a strong uptrend, price can walk along or repeatedly touch the upper band for an extended period, so many traders confirm band touches with other indicators like RSI before treating them as a reversal signal.
What does a Bollinger Band squeeze indicate?
A squeeze happens when the bands narrow significantly, which reflects a period of unusually low volatility that has historically often preceded a sharp price move, though the breakout direction isn’t predicted by the squeeze itself.
What’s the standard setting for Bollinger Bands?
The most common default is a 20-period simple moving average with bands set at 2 standard deviations, though some traders adjust the period or the multiplier depending on the asset’s typical volatility and their trading timeframe.
Can Bollinger Bands be used alone for trading decisions?
Most traders avoid relying on Bollinger Bands in isolation and instead combine them with volume, momentum indicators, or trend analysis, since band touches reflect statistical extremes rather than a guaranteed reversal.
Key Takeaways
Bollinger Bands wrap a moving average with volatility-based upper and lower bands that expand and contract with market conditions, helping traders visualize when price is statistically stretched — though band signals work best when confirmed with other indicators. This article is for informational purposes only and does not constitute investment advice.

QuantPro: AI Finds the Trade Before You Do
From AI-powered chart analysis to real-time market intelligence — everything a serious investor needs, in one platform.
- Automated AI chart analysis with precision trend timing
- Bull Radar: real-time visualization of geopolitical & economic shifts
- Live market-moving news and insights, curated for you

Bull Wave / Bear Wave Forecast Model
Engineered to help you read market direction and momentum faster than the crowd.
- Instantly separate bullish momentum from bearish pressure
- Pinpoint high-probability entry zones with confidence
- Chart signals clear enough for beginners, sharp enough for pros

Winning Pattern Detection
Instantly surfaces the high-probability setups that repeat across the charts — a trusted edge for timing your entries and exits.
- Spot momentum building in real time
- Catch trend-reversal points before they break
- Built for active traders who need results, not theory

AI Live Economic Dashboard
AI analyzes real-time market data — turning complex, global investment flows into clear insight in seconds.
- Track global stock markets in real time
- See exactly which assets are strong — and which are fading
- Watch how geopolitical events move the markets
About the Author