What Are the Golden Cross and Death Cross?
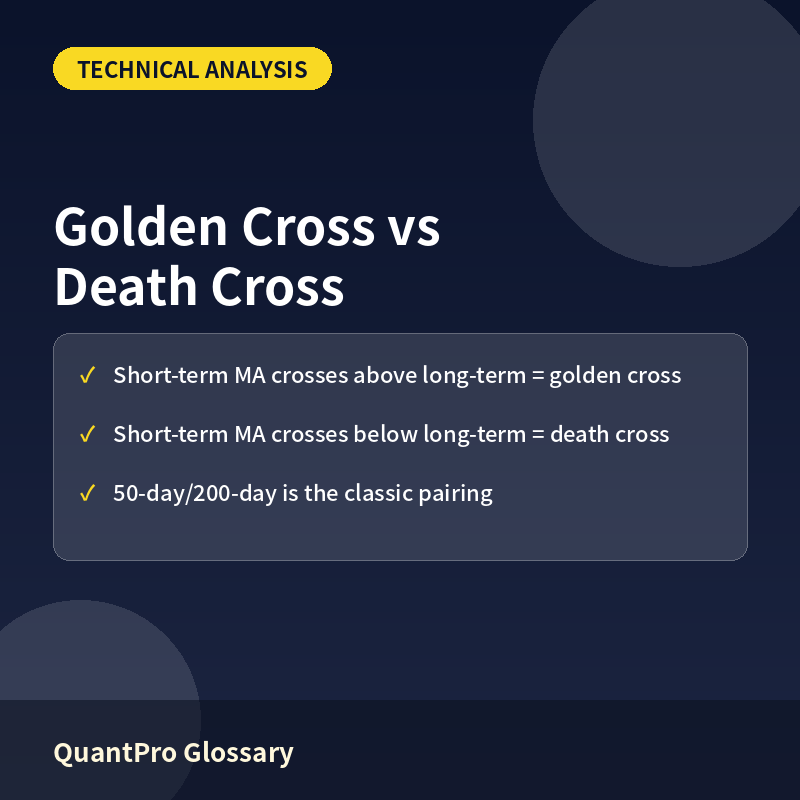
A golden cross occurs when a shorter-term moving average crosses above a longer-term moving average, while a death cross is the opposite — a shorter-term moving average crossing below a longer-term one. Both are technical analysis signals that use moving averages, a trend-smoothing tool, to try to spot potential trend reversals.
How the Crossovers Form
Common Moving Average Pairings
The most widely watched pairing is the 50-day and 200-day moving average, though shorter-term traders sometimes use faster combinations like the 5-day and 20-day. When the 50-day average crosses above the 200-day average specifically, it’s often treated by the broader market as a meaningful signal of a longer-term bullish trend shift.
Visualizing the Crossover
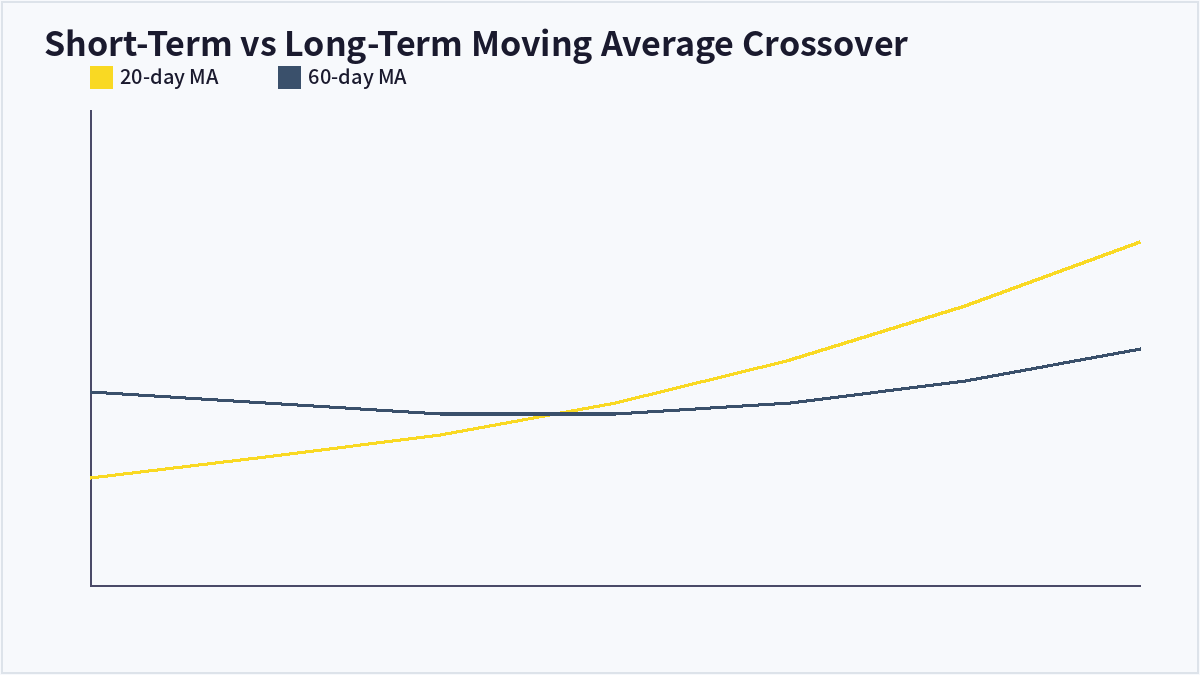
The chart below simplifies how a 20-day moving average can cross above a 60-day moving average. Before the crossover, the shorter average sits below the longer one; as upward momentum builds, it eventually pushes through and rises above, marking the golden cross point.
Why These Signals Matter
Moving average crossovers are a rules-based way to time entries and exits in trend-following strategies. Because moving averages are calculated from past prices, they’re inherently lagging indicators — by the time a crossover confirms, a meaningful part of the move may already have happened. In choppy, sideways markets, these crossovers can also generate frequent false signals known as whipsaws, so many traders confirm them with volume or other indicators.
Golden Cross vs Death Cross Comparison
The table below summarizes the direction and typical interpretation of each signal.
| Aspect | Golden Cross | Death Cross |
|---|---|---|
| Direction | Short-term MA crosses above long-term | Short-term MA crosses below long-term |
| Typical read | Bullish trend reversal | Bearish trend reversal |
| Classic pairing | 50-day / 200-day | 50-day / 200-day |
| Main limitation | Lagging, entry may come late | False signals in sideways markets |
Frequently Asked Questions
Does a golden cross guarantee the stock will keep rising?
No. Since moving average crossovers are lagging signals, a significant part of the rally may already be behind by the time the crossover confirms, and the trend can still reverse afterward.
Which moving average pairing should traders use?
Shorter pairings like 5-day/20-day suit short-term trading, while 50-day/200-day is more common for gauging longer-term trend shifts, but the ideal pairing can vary by asset and should typically be backtested.
Why do sideways markets produce false crossover signals?
When a price oscillates within a narrow range, the short-term and long-term averages tend to cross back and forth frequently, generating whipsaws that don’t reflect a genuine trend change.
Why combine crossovers with other indicators?
A golden cross accompanied by rising trading volume is generally considered more reliable, while a crossover on thin volume may be a weaker signal, so traders often confirm crossovers with volume or momentum indicators like RSI or MACD.
Key Takeaways
The golden cross and death cross use moving average crossovers to flag potential trend reversals, but their lagging nature and tendency toward false signals in sideways markets mean they work best alongside volume and other confirming indicators. This article is for informational purposes only and does not constitute investment advice.

QuantPro: AI Finds the Trade Before You Do
From AI-powered chart analysis to real-time market intelligence — everything a serious investor needs, in one platform.
- Automated AI chart analysis with precision trend timing
- Bull Radar: real-time visualization of geopolitical & economic shifts
- Live market-moving news and insights, curated for you

Bull Wave / Bear Wave Forecast Model
Engineered to help you read market direction and momentum faster than the crowd.
- Instantly separate bullish momentum from bearish pressure
- Pinpoint high-probability entry zones with confidence
- Chart signals clear enough for beginners, sharp enough for pros

Winning Pattern Detection
Instantly surfaces the high-probability setups that repeat across the charts — a trusted edge for timing your entries and exits.
- Spot momentum building in real time
- Catch trend-reversal points before they break
- Built for active traders who need results, not theory

AI Live Economic Dashboard
AI analyzes real-time market data — turning complex, global investment flows into clear insight in seconds.
- Track global stock markets in real time
- See exactly which assets are strong — and which are fading
- Watch how geopolitical events move the markets
About the Author