What Is the MACD Indicator?
Moving Average Convergence Divergence, or MACD, is a momentum-based technical analysis indicator that shows the relationship between two exponential moving averages (EMAs) of a security’s price. It is calculated by subtracting the 26-period EMA from the 12-period EMA, producing the “MACD line,” which oscillates above and below a zero line.
A second line, called the “signal line,” is a 9-period EMA of the MACD line itself, and it is plotted alongside the MACD line to help identify potential buy and sell signals. The difference between the MACD line and the signal line is often displayed as a histogram, visually representing the strength of momentum.
MACD Crossovers
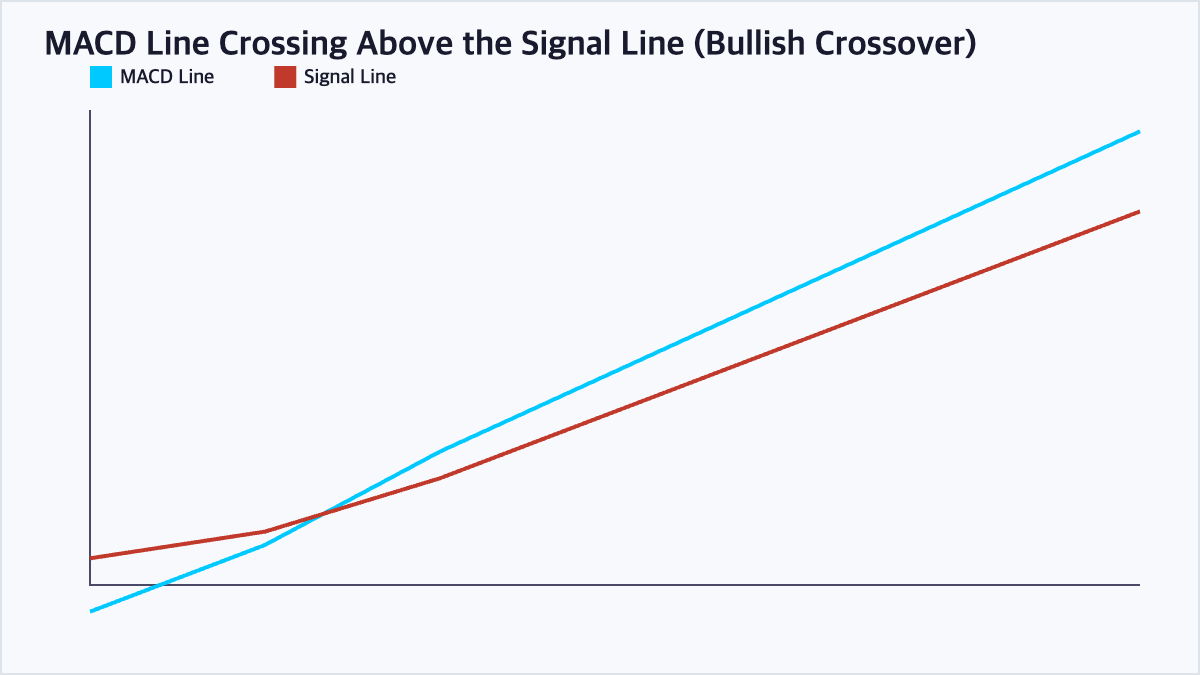
A bullish signal occurs when the MACD line crosses above the signal line, suggesting upward momentum may be building. A bearish signal occurs when the MACD line crosses below the signal line, suggesting downward momentum may be building. Traders often use these crossovers as potential entry or exit signals, particularly when combined with other confirming indicators.
Reading the MACD Histogram
The MACD histogram represents the numerical difference between the MACD line and the signal line, plotted as bars above or below zero. Growing histogram bars in either direction indicate strengthening momentum, while shrinking bars suggest momentum is fading, often ahead of an actual crossover in the lines themselves.
MACD Divergence
MACD divergence occurs when price moves in one direction while the MACD indicator moves in the opposite direction, which can signal weakening momentum behind the current trend. For example, if price makes a new high but the MACD fails to make a corresponding new high, it may suggest the uptrend is losing strength.
MACD Components at a Glance
| Component | Calculation | What It Shows |
|---|---|---|
| MACD Line | 12-period EMA minus 26-period EMA | Short vs long-term momentum |
| Signal Line | 9-period EMA of the MACD line | Smoothed trigger for crossovers |
| Histogram | MACD line minus signal line | Visual strength of momentum |
| Zero Line | Baseline reference | Overall trend direction (above/below) |
Frequently Asked Questions
Is MACD a leading or lagging indicator?
MACD is generally considered a lagging indicator because it is based on moving averages of past price data, meaning signals can occur somewhat after a trend has already begun, though the histogram can sometimes provide earlier hints of shifting momentum.
Can MACD be used on any timeframe?
Yes. MACD can be applied to any chart timeframe, from intraday to weekly or monthly charts, though the standard 12, 26, 9 settings may be adjusted by traders to better suit shorter or longer-term trading styles.
Should MACD be used in isolation for trading decisions?
Most technical analysts recommend using MACD alongside other indicators, such as volume or support and resistance levels, since relying on a single indicator increases the risk of acting on false or premature signals.
What does it mean when MACD is above the zero line?
When the MACD line is above the zero line, it indicates the shorter-term EMA is above the longer-term EMA, generally suggesting the overall trend is upward, while a MACD line below zero suggests a downward trend.
Key Takeaways
The MACD indicator tracks the relationship between two exponential moving averages to help identify momentum shifts, with crossovers and divergence between price and MACD offering potential trading signals. As a lagging indicator, MACD works best when combined with other technical tools for confirmation. This article is for informational purposes only and does not constitute investment advice.

QuantPro: AI Finds the Trade Before You Do
From AI-powered chart analysis to real-time market intelligence — everything a serious investor needs, in one platform.
- Automated AI chart analysis with precision trend timing
- Bull Radar: real-time visualization of geopolitical & economic shifts
- Live market-moving news and insights, curated for you

Bull Wave / Bear Wave Forecast Model
Engineered to help you read market direction and momentum faster than the crowd.
- Instantly separate bullish momentum from bearish pressure
- Pinpoint high-probability entry zones with confidence
- Chart signals clear enough for beginners, sharp enough for pros

Winning Pattern Detection
Instantly surfaces the high-probability setups that repeat across the charts — a trusted edge for timing your entries and exits.
- Spot momentum building in real time
- Catch trend-reversal points before they break
- Built for active traders who need results, not theory

AI Live Economic Dashboard
AI analyzes real-time market data — turning complex, global investment flows into clear insight in seconds.
- Track global stock markets in real time
- See exactly which assets are strong — and which are fading
- Watch how geopolitical events move the markets
About the Author