What Is the RSI Indicator?
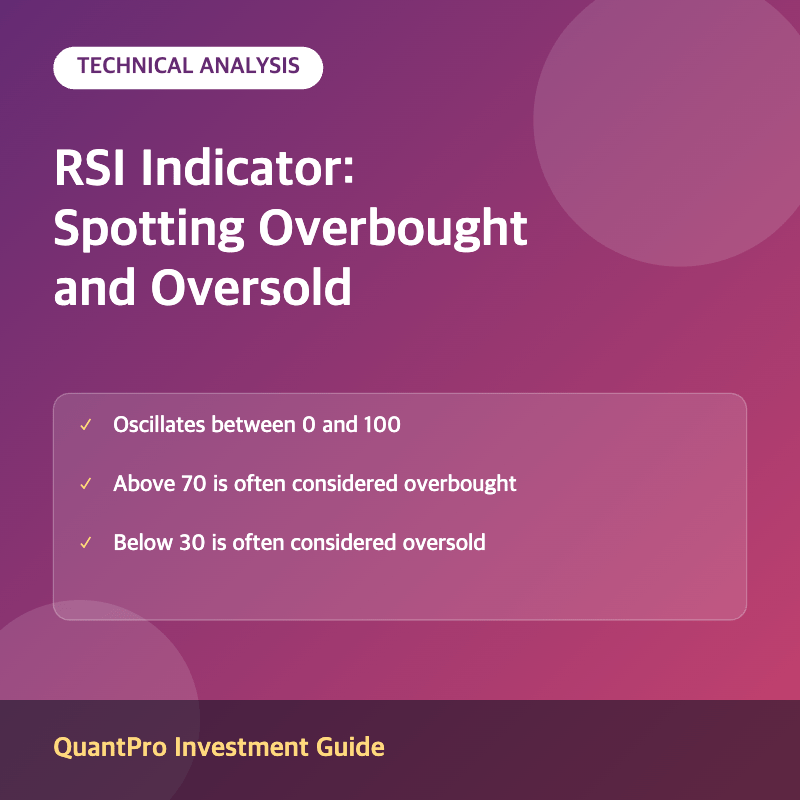
The Relative Strength Index, or RSI, is a momentum oscillator that measures the speed and magnitude of recent price changes to evaluate whether a security is overbought or oversold. Developed by J. Welles Wilder, RSI is calculated over a specified period, typically 14 trading periods, and oscillates on a scale from 0 to 100.
RSI is calculated by comparing the average magnitude of recent gains to the average magnitude of recent losses over the chosen lookback period, converting that ratio into a single value that reflects the strength of recent upward versus downward price movement.
Overbought and Oversold Levels
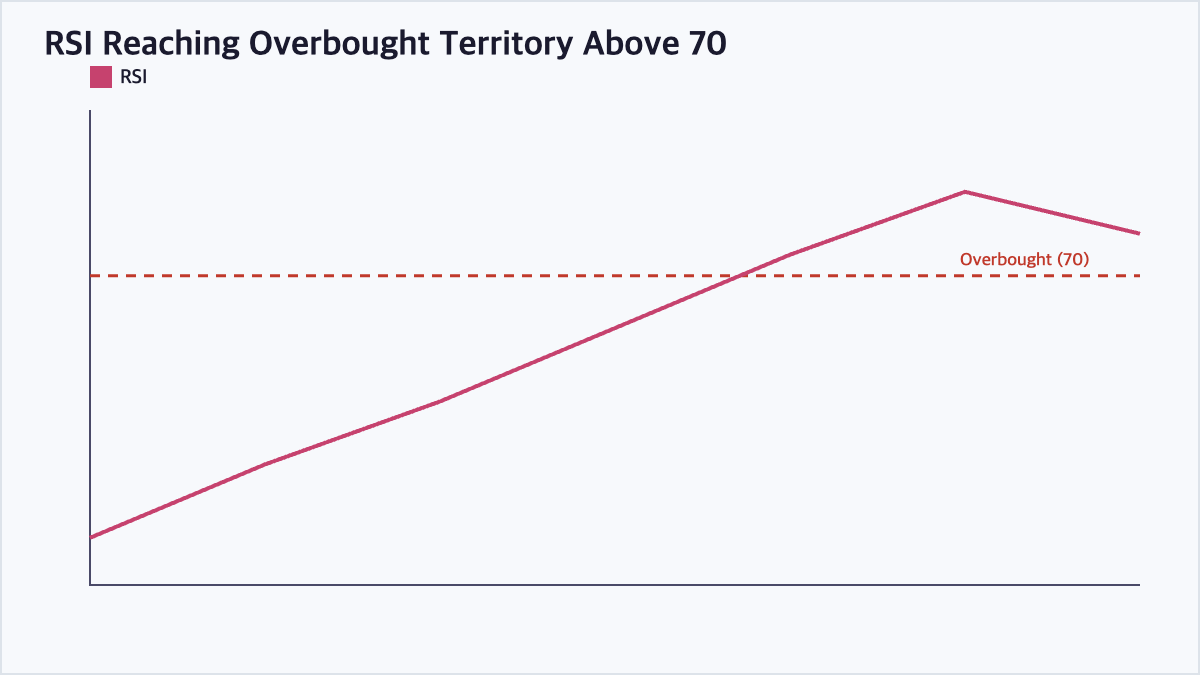
An RSI reading above 70 is traditionally considered overbought, suggesting the price may have risen too far too fast and could be due for a pullback or consolidation. An RSI reading below 30 is traditionally considered oversold, suggesting the price may have fallen too far too fast and could be due for a bounce. These thresholds are guidelines, not guarantees, and can be adjusted for different securities or market conditions.
RSI Divergence
Similar to other momentum indicators, RSI divergence occurs when price and the RSI indicator move in opposite directions, which can signal weakening momentum. Bullish divergence occurs when price makes a lower low while RSI makes a higher low, potentially signaling a reversal to the upside. Bearish divergence occurs when price makes a higher high while RSI makes a lower high, potentially signaling a reversal to the downside.
Limitations of RSI
During a strong, sustained trend, RSI can remain in overbought or oversold territory for an extended period without an immediate reversal, meaning traders who act on the overbought or oversold signal alone, without considering the broader trend, can be caught on the wrong side of a continuing trend.
RSI Signal Zones
| RSI Range | Interpretation | Common Trader Response |
|---|---|---|
| Above 70 | Overbought | Watch for potential pullback |
| 50–70 | Bullish momentum | Uptrend likely intact |
| 30–50 | Bearish momentum | Downtrend likely intact |
| Below 30 | Oversold | Watch for potential bounce |
Frequently Asked Questions
Does an overbought RSI reading always mean a price drop is imminent?
No. An overbought reading indicates strong recent upward momentum, but prices can remain overbought for extended periods during a powerful trend, so RSI is best used alongside trend analysis and other indicators rather than as a standalone reversal signal.
What is the standard period used to calculate RSI?
The most commonly used default period is 14, whether applied to days, weeks, or another timeframe, though traders sometimes use shorter periods, such as 9, for more sensitivity or longer periods, such as 25, for smoother, less frequent signals.
How is RSI different from the stochastic oscillator?
Both are momentum oscillators measuring overbought and oversold conditions, but RSI compares average gains to average losses over the lookback period, while the stochastic oscillator compares the current closing price to the recent high-low trading range, resulting in different sensitivity and signal timing.
Can RSI be combined with MACD for stronger signals?
Yes. Many traders combine RSI with MACD or other trend-following indicators to seek confirmation before acting on a signal, since agreement between multiple independent indicators generally increases confidence in a potential trade setup.
Key Takeaways
The RSI indicator measures momentum on a 0 to 100 scale, helping traders identify potentially overbought or oversold conditions and spot divergence between price and momentum. RSI works best as part of a broader analysis rather than as a standalone signal, especially during strong trending markets. This article is for informational purposes only and does not constitute investment advice.

QuantPro: AI Finds the Trade Before You Do
From AI-powered chart analysis to real-time market intelligence — everything a serious investor needs, in one platform.
- Automated AI chart analysis with precision trend timing
- Bull Radar: real-time visualization of geopolitical & economic shifts
- Live market-moving news and insights, curated for you

Bull Wave / Bear Wave Forecast Model
Engineered to help you read market direction and momentum faster than the crowd.
- Instantly separate bullish momentum from bearish pressure
- Pinpoint high-probability entry zones with confidence
- Chart signals clear enough for beginners, sharp enough for pros

Winning Pattern Detection
Instantly surfaces the high-probability setups that repeat across the charts — a trusted edge for timing your entries and exits.
- Spot momentum building in real time
- Catch trend-reversal points before they break
- Built for active traders who need results, not theory

AI Live Economic Dashboard
AI analyzes real-time market data — turning complex, global investment flows into clear insight in seconds.
- Track global stock markets in real time
- See exactly which assets are strong — and which are fading
- Watch how geopolitical events move the markets
About the Author